Introduction
India's installed renewable energy capacity hit 253.96 GW as of November 2025 — and nearly every GW of that was built from nothing. That's the defining reality of a greenfield asset: a project developed on undeveloped land, with no legacy infrastructure and no inherited liabilities. For renewable developers, commercial and industrial buyers, and infrastructure investors, knowing how to approach greenfield projects strategically can mean the difference between outsized returns and costly missteps.
The greenfield approach offers complete design freedom and lets developers deploy the latest technology without compromise. It also demands significant upfront capital, complex regulatory navigation, and multi-year development timelines.
This article covers what greenfield assets are, how they differ from brownfield and M&A approaches, the strategy behind successful projects, and why India has emerged as one of the world's most active greenfield markets.
TLDR:
- Greenfield assets are built from scratch — no legacy infrastructure, no inherited liabilities
- Full design control and latest technology, but higher capital and longer timelines required
- India attracted 1,080 renewable greenfield projects in 2024, ranking 4th globally
- Commissioned greenfield projects command premium valuations from yield-seeking investors
- Opten Power lists 4+ GW of greenfield projects across 16 states for discovery and transactions
What Is a Greenfield Asset?
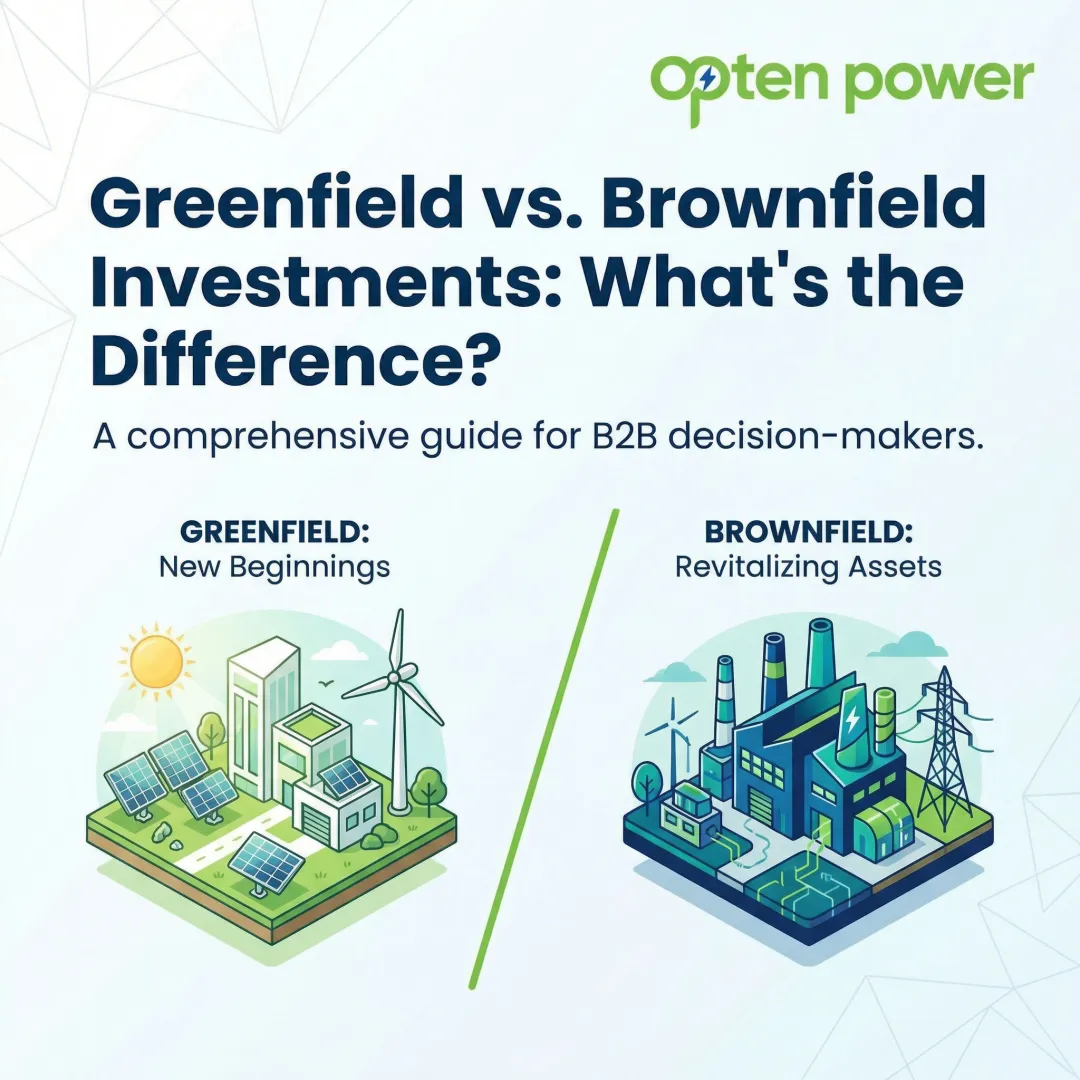
A greenfield asset is a project or facility built entirely from scratch on previously undeveloped land or in a sector with no prior infrastructure. The investor or developer starts with a clean slate — no legacy systems, no inherited liabilities, and complete freedom to design every aspect of the project.
The term originates from the literal image of an empty "green field" awaiting development. While it can apply to any domain without pre-existing structure, it contrasts sharply with **brownfield** assets, which involve redeveloping or repurposing existing facilities. Where brownfield offers speed and established infrastructure, greenfield delivers maximum control and the ability to implement the latest technology from day one.
Key Characteristics:
- Choose specifications, technology, and operational standards without compromise
- Deploy automation, smart monitoring, and optimized layouts without legacy constraints
- Start without environmental liabilities, outdated equipment, or prior contractual obligations
- Establish processes, maintenance protocols, and performance standards from the ground up
- Design infrastructure with scalability built in from the outset
The IMF and OECD formally define greenfield investment as "altogether new investments that bring new and additional resources and assets to the enterprise and often lead to gross fixed capital formation." This distinguishes new capacity creation from the transfer of existing assets.
That definition applies broadly — greenfield assets span solar and wind farms, manufacturing plants, airports, telecom networks, and software platforms. The concept is especially prominent in energy and infrastructure, where India has emerged as a leading destination. UNCTAD ranked India 4th globally for greenfield project announcements in 2024, with 1,080 projects announced across sectors.
Greenfield vs. Brownfield vs. M&A: Key Differences
Brownfield Assets involve acquiring, upgrading, or repurposing an existing facility. The trade-off is clear: lower upfront risk and faster time-to-operation, but you inherit legacy infrastructure, potential environmental liabilities, and design constraints that limit optimization.
M&A (Mergers and Acquisitions) means acquiring an existing company or its operating assets, offering speed-to-market and established customer bases. Greenfield means building independently, delivering maximum control and long-term customization.
| Asset Type | Development Timeline | Capital Intensity | Level of Control | Risk Profile | Typical Use Case |
|---|---|---|---|---|---|
| Greenfield | 18-36 months | High (₹4-6 crore/MW for solar) | Complete design authority | High construction risk, no revenue until COD | New solar parks, wind farms, manufacturing plants |
| Brownfield | 6-12 months | Medium (acquisition + upgrades) | Constrained by existing infrastructure | Lower construction risk, inherited liabilities | Repowering old wind farms, upgrading solar plants |
| M&A | 3-6 months | Variable (acquisition cost) | Limited to acquired assets | Operational risk, integration challenges | Acquiring operational portfolios, market entry |

When Each Approach Makes Strategic Sense:
Greenfield is preferred when investors need full design control, want to implement the latest technology (bifacial solar modules, high-capacity wind turbines), and are targeting markets with no suitable existing assets. Deploying hybrid solar-wind-storage projects, for instance, typically requires greenfield development to integrate multiple technologies without inheriting infrastructure constraints.
Brownfield or M&A makes more sense when speed, existing permits, or customer relationships are the priority. Acquiring an operational 100 MW solar project eliminates 18-24 months of development risk and provides immediate cash flow.
In practice, these categories often overlap. A developer may acquire land through a greenfield approach while partnering with an existing grid operator for transmission — a hybrid structure that trades some control for reduced infrastructure risk. Recognizing where a deal sits on this spectrum lets investors calibrate the right balance of speed, control, and capital exposure.
Greenfield Investment Strategy: How to Approach It
Phase 1: Pre-Development and Feasibility
A successful greenfield strategy begins with deep site selection, resource assessment, regulatory landscape mapping, and financial modelling. For renewable energy projects, this means analyzing solar irradiance data or wind potential using tools like NREL's System Advisor Model (SAM) or conducting on-site wind measurement campaigns lasting 12+ months.
This phase determines whether a project is viable before significant capital is deployed. Key activities include:
- Land identification with clear title and minimal acquisition disputes
- Resource assessment using historical meteorological data and site surveys
- Grid connectivity feasibility analysis with the Central Transmission Utility (CTU) or State Load Dispatch Centers
- Financial modelling covering capital expenditure, operating costs, tariff assumptions, and Internal Rate of Return (IRR) projections
Platforms like Opten Power simplify this phase by providing access to pre-vetted projects across 16 states, with verified details on capacity, tariff, technology, and developer credentials. Instant IRR and payback analysis helps investors screen opportunities in seconds rather than weeks.
Phase 2: Permitting, Land Acquisition, and Regulatory Clearance
Greenfield projects in regulated industries like energy require navigating multiple government approvals. In India, land acquisition alone takes 6-24 months, and transmission infrastructure build-out can extend 24-36 months, contributing to average project delays of 17 months.
Critical regulatory steps include:
- Environmental clearances from State Environment Impact Assessment Authorities (SEIAA)
- Grid connectivity applications through CTU's Stage-I and Stage-II procedures under CERC's 2022 GNA Regulations
- Land rights acquisition, including conversion of agricultural land to non-agricultural use
- State-level policy compliance with State Electricity Regulatory Commissions (SERCs) for open access approvals
India's regulatory environment involves coordination across the Ministry of New and Renewable Energy (MNRE), CERC, SERCs, and Distribution Companies (DISCOMs). Early regulatory engagement and legal due diligence are essential to avoid bottlenecks that can delay projects by years.
Phase 3: Engineering, Procurement, and Construction (EPC)
Once permits are secured, the project moves into design and construction. With no legacy system constraints, greenfield projects can deploy the latest technology from day one, a flexibility that brownfield upgrades rarely allow.
Modern solar projects use bifacial modules with tracking systems achieving capacity utilization factors (CUF) above 25%. Wind projects deploy turbines with hub heights exceeding 120 meters to capture stronger wind resources. Hybrid projects integrate solar, wind, and battery energy storage systems (BESS) to deliver firm, dispatchable power.
The EPC phase typically spans 12-18 months for utility-scale solar and 18-24 months for wind projects, depending on site conditions and equipment availability.
Phase 4: Commissioning and Operations
A greenfield asset transitions from construction to operational status through grid synchronization, testing, and handover protocols. For renewable energy projects, this includes:
- Grid synchronization testing and compliance with Grid Code requirements
- Performance testing to validate capacity and generation guarantees
- Handover to Operations & Maintenance (O&M) teams with long-term service contracts
- Activation of Power Purchase Agreements (PPAs) and revenue recognition

Long-term PPA structures secure revenue certainty for 25 years, making projects financeable and attractive to debt lenders. Opten Power's automated tender engine and pre-approved contract templates help developers structure offtake arrangements faster, reducing the time from PPA negotiation to financial close.
Project Finance in Greenfield Strategy
Most large greenfield assets are financed through project finance structures — non-recourse or limited-recourse debt secured against the project's future cash flows rather than the sponsor's balance sheet. This approach allows developers to take on large projects without overextending corporate capital.
These structures differ in one key dimension: lender exposure to sponsor assets.
| Structure | Lender Recourse | Typical Use Case |
|---|---|---|
| Non-recourse | Project cash flows only; no claim on sponsor assets | Operational or near-complete projects |
| Limited-recourse | Restricted sponsor asset access during construction | High-risk early-stage phases |
Debt costs for Indian greenfield solar and wind projects range from 8.5% to 9.75%, with overall Weighted Average Cost of Capital (WACC) expanding to 10.3% by 2024 due to global monetary tightening. IRR and payback period are the primary evaluation metrics — and project returns move significantly with shifts in PPA tariffs, capacity utilization factors, capital expenditure, and financing costs.
Benefits of Greenfield Assets
Full Control and Customization
Greenfield development gives investors and developers complete authority over design specifications, technology choices, and operational standards — unlike acquired assets where compromises are inevitable. In renewable energy, those choices compound over a 25-year project life.
Choosing the latest bifacial solar modules over standard panels can increase generation by 10-15%. Deploying advanced wind turbines with higher hub heights can boost capacity factors from 20% to 30%. These decisions are only possible with greenfield projects.
Long-Term Value Creation
The design control described above feeds directly into long-term financial outcomes. Greenfield projects take longer to generate returns, but they create assets that appreciate in value once operational — with the potential to be refinanced or sold as brownfield assets at a premium.
In October 2025, Sembcorp acquired a 100% stake in ReNew's 300 MW operational solar project in Rajasthan for approximately ₹1,600 crore ($191.6 million). Operational assets command lower cost of equity and debt because construction, land, and permitting risks have been eliminated. That de-risked profile makes them highly attractive to yield-seeking secondary buyers like Infrastructure Investment Trusts (InvITs).
Incentives and Policy Tailwinds
Governments in developing economies — especially India — actively incentivize greenfield investment through multiple mechanisms:
- Accelerated Depreciation: 40% depreciation rate for solar and wind power systems under Section 32(1)(iia) of the Income Tax Act
- Viability Gap Funding: ₹9,400 crore scheme for 4,000 MWh of Battery Energy Storage Systems, covering up to 40% of capital costs
- Renewable Energy Certificates (RECs): Market-discovered pricing with certificate multipliers valid for 15 years under CERC's 2022 REC Regulations
- ISTS Waiver: 100% waiver of Inter-State Transmission System charges for projects commissioned by June 30, 2025
- Production Linked Incentive: ₹19,500 crore outlay to support GW-scale domestic solar module manufacturing

Stacked together, these incentives can shift a greenfield solar or wind project's IRR from the low teens into the 15-18% range — closing the gap between construction-stage risk and brownfield-equivalent returns.
Risks and Challenges of Greenfield Investment
High Capital Intensity and Long Development Timelines
Greenfield projects require significant upfront capital with no near-term revenue. Utility-scale renewable projects in India face average delays of 17 months (P50), extending up to 26 months (P90) beyond standard 18-24 month Scheduled Commercial Operation Dates.
Three compounding risk factors drive most of these delays:
- Cost overruns: Oxford University's megaproject database shows 91.5% of large projects exceed budget or schedule, with average cost overruns of 62%
- Land acquisition: Fragmented ownership and complex state-level regulations push timelines to 18-24 months across many Indian states
- Ecological constraints: The Great Indian Bustard habitat in Rajasthan has delayed transmission line construction by up to 48 months, affecting multiple greenfield solar projects
Regulatory and Political Risk
India's 28+ states and union territories each carry their own regulatory frameworks — and variability between them is a genuine execution risk. Land acquisition disputes, shifting DISCOM tariff orders, and grid connectivity delays can derail even well-planned projects.
DISCOM accumulated losses reached ₹6.92 lakh crore in FY24, with an Average Cost of Supply-Average Revenue Realized (ACS-ARR) gap of ₹0.39/kWh. This financial distress elevates counterparty and payment delay risks for developers.
Mitigation strategies include:
- Early regulatory engagement with state authorities
- Comprehensive legal due diligence on land titles
- Partnering with locally experienced developers who understand state-level nuances
- Structuring payment security mechanisms in PPAs
Offtake and Revenue Uncertainty
Before a greenfield asset is operational, there is no guaranteed revenue stream. Securing a PPA or long-term offtake agreement before or during construction substantially de-risks the investment.
Recent SECI auctions demonstrate competitive tariff discovery across asset types: solar at ₹2.57/kWh, wind at ₹3.97/kWh, hybrid at ₹3.25-3.26/kWh, and solar + BESS at ₹3.42/kWh. Developers must balance competitive bidding with project economics to maintain acceptable returns.
Platforms like Opten Power help developers reduce this uncertainty by providing real-time DISCOM intelligence with standardized landing prices across all states, enabling accurate cost comparisons. Pre-approved contract templates simplify PPA negotiations, helping developers structure bankable offtake arrangements and close deals up to 50% faster than traditional procurement methods.
Greenfield Assets in India's Renewable Energy Sector
India is one of the most active greenfield energy investment destinations globally. The government has set a target of 500 GW of non-fossil fuel energy capacity by 2030, with total renewable energy installed capacity reaching 253.96 GW (including large hydro) as of November 2025. Solar capacity stands at 132.85 GW and wind at 53.99 GW.
Declining solar and wind tariffs, combined with a large addressable market from commercial and industrial consumers seeking clean power through long-term contracts, make India highly attractive. Open access annual installations are estimated to exceed 6 GW in FY2025, driven by C&I buyers looking to reduce energy costs by up to 40% versus grid tariffs.
Types of Greenfield Renewable Energy Assets:
- Utility-scale solar parks — ground-mounted installations from 50 MW to 1,000+ MW
- Onshore wind farms (50–200 MW), concentrated in high-wind states like Gujarat, Tamil Nadu, and Karnataka
- Hybrid solar + wind + storage projects that deliver firm, dispatchable renewable energy
- Captive and group captive plants serving specific industrial buyers through open access
These project types serve distinct investor profiles. IPPs typically pursue utility-scale and hybrid assets, while C&I industrials gravitate toward captive and open-access structures that directly offset their grid bills and support ESG targets.
Platforms like Opten Power simplify greenfield project discovery and evaluation for developers, investors, and C&I buyers. The platform covers 4+ GW of renewable projects across 16 states, reducing the due diligence time typically required for greenfield energy transactions.
Key capabilities include:
- Real-time IRR and payback analysis across pre-vetted projects
- Standardized DISCOM intelligence with updated landing prices by state
- Automated RFPs and pre-approved contract templates to accelerate deal closure
- A single portfolio dashboard covering the full project lifecycle
Frequently Asked Questions
What is a greenfield asset?
A greenfield asset is a project or facility built entirely from scratch on undeveloped land or in an undeveloped sector, with no prior infrastructure or legacy systems. Investors start with a clean slate, gaining full design control but accepting higher upfront capital requirements and longer development timelines.
What are some examples of greenfield investments?
Common examples include utility-scale solar parks in Rajasthan and Gujarat, onshore wind farms in Tamil Nadu and Karnataka, hybrid solar-wind-storage projects across multiple states, and new manufacturing plants developed in previously unserved regions. Each starts with no prior infrastructure and requires full development from site acquisition onward.
What are the pros and cons of greenfield investment?
Pros: full design control, latest technology deployment, no inherited liabilities, and access to incentives like accelerated depreciation and viability gap funding.
Cons: high capital outlay (₹4–6 crore/MW for solar), 18–36 month commissioning timelines, multi-authority regulatory processes, and no revenue until commercial operation date.
What is the difference between greenfield and brownfield assets?
Greenfield assets are built from scratch on new land with no prior use, offering complete design freedom and the latest technology. Brownfield assets involve redeveloping or repurposing existing facilities, offering faster time-to-operation and lower upfront risk but inheriting legacy infrastructure, potential liabilities, and design constraints that limit optimization.
How does greenfield investment differ from other forms of foreign direct investment (like M&A)?
Greenfield FDI involves building new facilities independently from the ground up, maximizing control and customization but requiring longer timelines and higher capital. M&A involves acquiring an existing business or operational asset, offering speed-to-market and established customer bases but inheriting prior structure, liabilities, and integration challenges.
What is greenfield project finance?
Greenfield project finance is a non-recourse or limited-recourse structure where debt is secured against the project's own future cash flows — not the developer's corporate balance sheet. Lenders rely on project assets, PPAs, and contracted revenue streams for repayment, allowing developers to finance large infrastructure projects without overextending corporate capital.