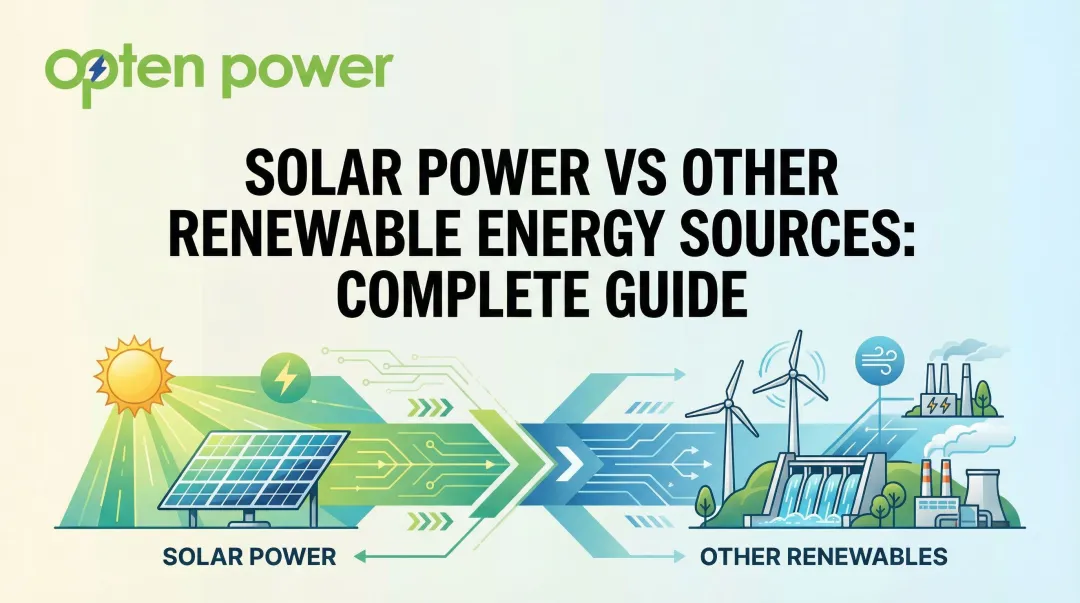
Introduction
For commercial and industrial businesses across India, rising grid tariffs and tightening sustainability mandates have shifted the renewable energy question from "whether" to "when." But before signing a 15–25 year power purchase agreement or deploying capital into a captive solar plant, one challenge remains: proving the financial case.
Most energy procurement decisions lack a structured cost-benefit framework. Without one, businesses face poor vendor comparisons, missed savings, and misread risks — particularly in India's layered regulatory environment of DISCOM tariffs, open access regulations, and RPO obligations.
A renewable energy cost-benefit analysis (CBA) provides the financial rigor to navigate these complexities. This guide covers the key costs and benefits, the financial metrics that matter, and a step-by-step methodology to build a defensible business case for solar, wind, or hybrid procurement.
Key Takeaways
- A renewable CBA compares total lifecycle costs against financial, environmental, and regulatory benefits over 15–25 years
- Key costs include CapEx, O&M, grid integration, wheeling charges, and financing—not just panel prices
- Benefits span bill savings, tariff volatility hedges, GHG reduction, RPO compliance, and brand credibility
- Master four metrics: LCOE, NPV, IRR, and payback period — each answers a different question about project value
- Opten Power automates IRR, payback, and multi-developer tariff comparisons in real time, helping commercial and industrial buyers decide faster
Key Costs to Evaluate in a Renewable Energy CBA
A credible CBA covers total cost of ownership — not just equipment prices. C&I buyers who skip integration and compliance costs routinely overestimate savings, which is where most project failures begin.
Capital Expenditure (CapEx)
Upfront costs differ by technology and project scale:
- Solar: panels, inverters, mounting structures, and grid interconnection
- Wind turbines (nacelle, tower, blades, hub) plus civil works and evacuation infrastructure
- Hybrid projects combine both technologies with shared evacuation infrastructure; costs vary by wind-to-solar capacity ratio
Current benchmarks for India:
- Utility-scale solar: ₹3.5–4.5 Crore/MW
- Onshore wind: ₹6.7–9.1 Crore/MW, averaging ₹7.9 Crore/MW for projects up to 300 MW
- Hybrid (wind-solar): ₹5.5–12.5 Crore/MW, depending on capacity mix and scale
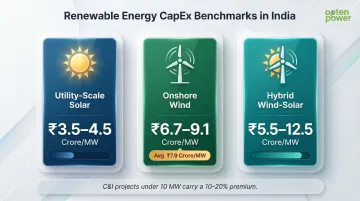
For C&I projects under 10 MW, expect a 10–20% premium over utility-scale benchmarks due to diseconomies of scale.
Operational & Maintenance (OpEx)
Renewables have low but non-zero O&M costs:
- Annual maintenance contracts and performance monitoring
- Insurance premiums and property taxes
- Component replacements (inverters typically need replacement every 10–12 years)
- Staff costs for on-site or remote monitoring
Unlike fossil fuels — where fuel cost dominates OpEx — renewable O&M is predictable. Solar typically runs 1–2% of CapEx annually; wind runs slightly higher.
Grid & Regulatory Costs
India-specific cost components frequently overlooked:
- Wheeling and transmission charges for open access projects (vary by state DISCOM)
- Banking charges for excess generation stored on the grid
- Cross-subsidy surcharge to compensate DISCOMs for lost revenue
- RPO compliance costs if not met through captive generation
These charges vary by state and can add ₹0.50–1.50/kWh to the landed cost of renewable energy — enough to materially shift project economics.
Financing Costs
Debt-equity structure affects total cost:
- Interest rates on project debt (typically 9–11% for renewable projects in India)
- Equity returns expected by investors (12–18% IRR benchmarks)
- Tenure impact on levelized costs — longer tenure spreads CapEx over more units, lowering LCOE
Corporate PPAs typically shift CapEx risk to developers, converting the buyer's cost profile from upfront capital to per-unit tariff payments. That shift changes how you model costs — and which lifecycle line items actually land on your books.
Hidden and Lifecycle Costs
Often excluded from initial proposals:
- Decommissioning costs at end-of-life (20–25 years)
- Land lease escalation clauses that increase rental costs over time
- Technology refresh for battery storage (if included in hybrid projects)
- Grid upgrade costs if existing infrastructure can't handle additional capacity
Projects that skip these line items often look attractive at sanction stage — and underperform through their operational life.
Key Benefits of Renewable Energy for C&I Businesses
Switching to renewable energy does more than cut your electricity bill. For C&I businesses in India, the financial, operational, and reputational gains add up quickly—and most are directly measurable.
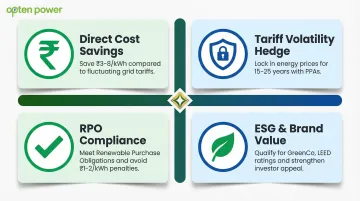
Direct Energy Cost Savings
Renewable energy through long-term PPAs provides electricity at fixed or lower tariffs compared to DISCOM grid supply, which increases annually. Average C&I industrial tariffs in India range from ₹7–12/kWh depending on the state, while solar PPA rates have fallen to ₹2.50–4.00/kWh, creating immediate savings of ₹3–8/kWh.
Tariff Volatility Hedge
Locking in renewable rates through a 15–25 year PPA shields businesses from grid tariff escalation. For energy-intensive industries—steel, cement, textiles—where energy accounts for 20–40% of operating costs, that price certainty is a meaningful risk mitigation tool.
Environmental and GHG Benefits
Key environmental benefits include:
- Reduces Scope 2 carbon emissions, directly supporting net-zero commitments
- Improves ESG scores for publicly traded companies and multinationals
- Creates financial value through avoided carbon costs as India's carbon credit and PAT (Perform, Achieve, Trade) schemes mature
Renewable generation reduces emissions by approximately 0.7–0.9 tonnes CO₂ per MWh compared to India's grid average.
Regulatory Compliance and RPO Benefits
India's Renewable Purchase Obligation (RPO) framework mandates that industries in many states source a percentage of consumption from renewables. Proactively meeting RPO through captive, group captive, or open access projects reduces compliance costs and avoids penalties—typically ₹1–2/kWh for non-compliance.
Brand, ESG, and Stakeholder Value
Renewable commitments improve:
- Strengthens brand reputation among customers and local communities
- Unlocks eligibility for green certifications like GreenCo and LEED
- Attracts ESG-focused investors and can lower the cost of capital
- Supports employee recruitment and retention—particularly relevant for data centres, IT parks, and MNCs with global sustainability targets
How to Conduct a Renewable Energy CBA – Step by Step
Poor CBA analysis — built on wrong assumptions or incomplete cost inputs — is how C&I buyers end up locked into unfavorable contracts for 20+ years. These six stages reflect how energy-intensive businesses actually make procurement decisions.
Step 1 – Define Your Energy Baseline and Goals
Identify foundational inputs:
- Current consumption (kWh/year) and peak demand (kW)
- Load profile (24x7 base load vs. daytime only)
- Existing tariff structure and annual escalation rate
- Sustainability and RPO targets
An accurate baseline is the single most important input—errors here propagate through the entire analysis.
Step 2 – Identify the Right Renewable Energy Model
Main procurement models for C&I buyers:
- Rooftop solar (captive): Full ownership, highest long-term savings, requires upfront capital
- Open access (third-party or group captive): Access to off-site utility-scale projects, subject to wheeling and banking charges
- Corporate PPA (off-site): Zero CapEx, fixed tariff, developer retains asset ownership
Model selection affects cost structure, risk profile, and which costs and benefits apply.
Step 3 – Collect and Standardize Cost Inputs
Gather and standardize:
- CapEx quotes or PPA tariff proposals from multiple developers
- O&M estimates and financing terms
- Wheeling, transmission, and cross-subsidy charges for your state
- Land or lease costs
Comparing proposals manually across developers is time-consuming and error-prone. Platforms like Opten Power consolidate real-time tariff data and savings projections in one place, cutting this step from weeks to hours.
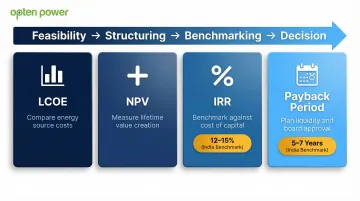
Step 4 – Quantify Benefits and Model Financial Metrics
Calculate four core metrics:
| Metric | What It Measures | How to Use It |
|---|---|---|
| LCOE (Levelized Cost of Energy) | Total lifecycle cost ÷ total energy produced | Compare renewable tariff against current grid rate |
| NPV (Net Present Value) | Present value of future cash flows minus upfront investment | Positive NPV = value creation; negative = walk away |
| IRR (Internal Rate of Return) | Discount rate at which NPV = zero | Benchmark against your cost of capital |
| Simple Payback Period | Years to recover initial investment via savings | Useful for liquidity planning and board approval |
Step 5 – Stress-Test Assumptions (Sensitivity Analysis)
Vary key assumptions to test ROI robustness:
- Tariff escalation rates (what if grid tariff increases slow?)
- Generation yield / PLF (what if actual output is 10% lower?)
- Financing rates (what if interest rates rise?)
- Policy changes (what if wheeling charges double?)
A 10% PLF shortfall, for example, can push a 5-year payback to 6.5+ years — enough to flip a positive IRR negative. Model this range before signing any long-term contract.
Step 6 – Make the Decision and Negotiate the Contract
CBA outputs feed directly into:
- Vendor selection based on NPV and IRR
- Contract negotiation: tariff floors, performance guarantees, exit provisions
- Annual review as actual performance data becomes available
Renewable Energy CBA Walkthrough: A C&I Industrial Example
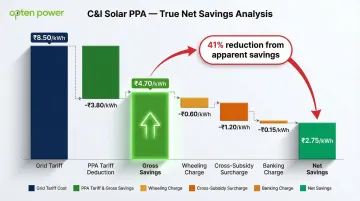
Scenario: A mid-size textile manufacturing unit with 5 MW average demand, currently on DISCOM grid at ₹8.50/kWh, evaluating a solar open access project.
Current Annual Energy Cost:
- Consumption: 5 MW × 24 hours × 365 days × 70% PLF = 30.66 million kWh/year
- Annual cost: 30.66 million kWh × ₹8.50 = ₹26.06 Crore/year
Proposed Solar Open Access PPA:
- PPA tariff: ₹3.80/kWh (fixed for 25 years)
- Gross savings: ₹8.50 - ₹3.80 = ₹4.70/kWh
- Wheeling charges: ₹0.60/kWh
- Cross-subsidy surcharge: ₹1.20/kWh
- Banking charges: ₹0.15/kWh
- Net savings: ₹4.70 - ₹1.95 = ₹2.75/kWh
Annual Net Savings:
- 30.66 million kWh × ₹2.75 = ₹8.43 Crore/year
Financial Metrics (assuming zero CapEx under PPA model):
- NPV (15-year contract, 10% discount rate): ₹64.1 Crore
- IRR: Not applicable (no upfront investment in PPA model)
- Payback: Immediate (ongoing savings with no capital deployment)
Key Insight: Including wheeling and banking costs reduced apparent savings from ₹4.70/kWh to ₹2.75/kWh—a 41% difference. A surface-level bill comparison would have overstated the financial benefit.
This same methodology applies directly to wind and hybrid projects. Scale also shifts the numbers: a 20 MW project typically secures lower wheeling charges and tighter PPA rates than a 5 MW deal, compressing per-unit costs further and improving overall NPV.
How Opten Power Simplifies Your Renewable Energy CBA
Opten Power is India's unified clean energy marketplace, removing the most time-consuming parts of the CBA process: sourcing comparable proposals, comparing DISCOM tariffs across 16 states, and running financial models.
Platform capabilities relevant to CBA:
- Compares IRR, payback period, and tariffs across 4+ GW of solar, wind, and hybrid projects in real time
- Generates and manages RFPs automatically, collecting comparable proposals from multiple developers
- Pulls updated DISCOM landing prices across all states for accurate, apples-to-apples cost comparisons
- Tracks energy investments post-procurement through a unified portfolio dashboard
C&I buyers using Opten Power compare developer proposals, run instant financial analysis, and close deals up to 50% faster—cutting both the time and cost of the CBA process itself.
Frequently Asked Questions
What financial metrics matter most in a renewable energy cost-benefit analysis?
The four key metrics are LCOE for comparing energy sources, NPV for total lifetime value, IRR for investment return, and payback period for liquidity planning. IRR above 12–15% (your cost of capital) and payback under 5–7 years are common benchmarks for C&I projects in India.
What is the typical payback period for a C&I renewable energy project in India?
Payback periods typically range from 3–4 years for rooftop solar captive projects to 5–7 years for open access projects, depending on project scale, technology type, and state-specific charges like wheeling and cross-subsidy surcharges.
How does a Corporate PPA differ from owning a renewable energy project outright?
A Corporate PPA shifts CapEx and performance risk to a developer while the buyer pays a fixed per-unit tariff with zero upfront capital. Owned projects require upfront investment but offer greater long-term savings once costs are recovered and full depreciation benefits.
What hidden costs do businesses most commonly miss in a renewable energy CBA?
Wheeling and transmission charges, cross-subsidy surcharge, banking fees, land lease escalation, and inverter replacement costs are frequently excluded. For open access projects, state-level charges alone can range from ₹0.50 to ₹2.00/kWh—a gap that significantly affects your actual landed energy cost.
How does renewable energy help C&I businesses manage regulatory and compliance risks?
Renewable procurement helps meet India's RPO mandates (typically 15–25% of consumption) and avoids non-compliance penalties of ₹1–2/kWh. It also positions businesses ahead of tightening carbon regulations under India's PAT scheme and emerging carbon credit markets.
What drives the ROI of a renewable energy project?
Local resource quality, state-level open access charges, the PPA tariff locked in, DISCOM tariff trajectory, and project scale are the primary ROI drivers. Modeling all these variables before committing to a developer—through a platform like Opten Power—helps avoid costly surprises.