Introduction
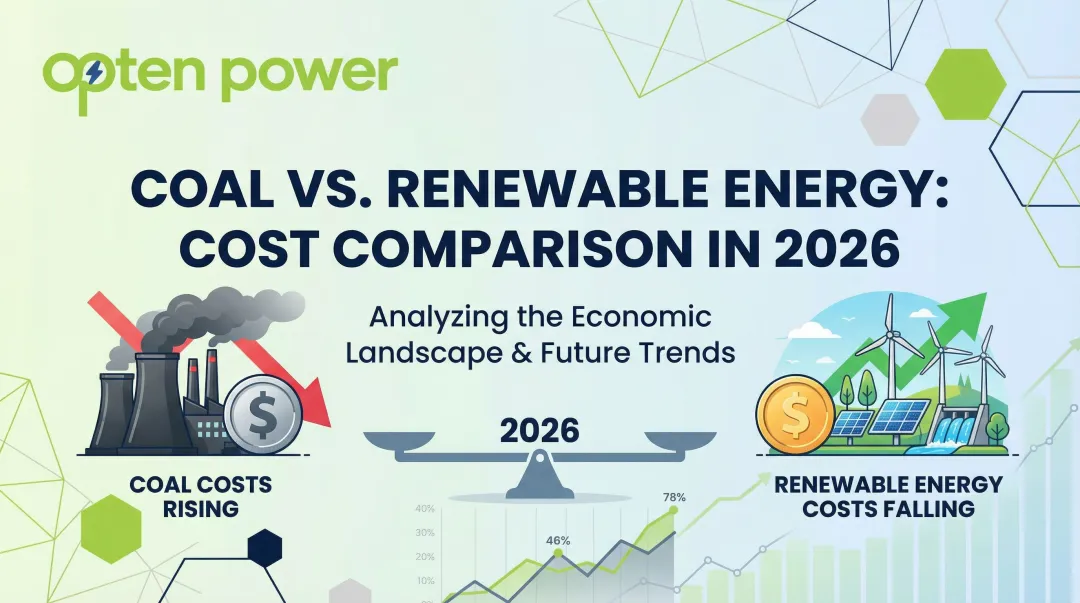
For decades, the assumption held firm: clean energy costs more than fossil fuels. That narrative has collapsed. According to the International Renewable Energy Agency (IRENA), more than 90% of new renewable energy capacity added globally in 2024 was cheaper than the least-cost fossil fuel alternative. The debate has shifted from "if" to "how quickly" businesses will transition.
For commercial and industrial (C&I) businesses in India, that shift translates directly to the balance sheet. Industrial electricity bills routinely account for 15-20% of total operating costs in sectors like textiles, steel, and cement.
Yet many C&I buyers still overpay — locked into volatile DISCOM tariffs while renewable options sit at record lows. This article breaks down the real cost numbers, explains why the gap keeps widening, and shows what procurement options are available to businesses ready to act.
TLDR: Key Takeaways
- Utility-scale solar and onshore wind now consistently beat fossil fuels on levelized cost in most global markets
- Solar PV costs have dropped 90% and onshore wind 70% over the past decade
- Fossil fuel prices swing with geopolitical shocks; renewable costs are largely fixed once capacity is built
- India has emerged as one of the world's most competitive renewable energy markets, with solar auction prices reaching ₹1.99/kWh
- C&I businesses can secure cheaper power and protect against tariff volatility through long-term Corporate PPAs
Understanding LCOE: The Right Metric to Compare Energy Costs
What LCOE Measures:
Levelized Cost of Energy (LCOE) is the all-in average cost per unit of electricity generated over a plant's lifetime. It accounts for:
- Capital expenditure (construction, equipment)
- Operations and maintenance (O&M)
- Fuel costs
- Financing costs
- Total electricity generation over the project's life
IRENA, BloombergNEF (BNEF), Lazard, and the IEA all use LCOE as the standard benchmark to compare technologies on equal footing. It answers a simple question: What does each kWh actually cost when you factor in everything?
Renewables vs. Fossil Fuels: Different Cost Structures:
The fundamental difference between renewables and fossil fuels lies in their cost structure:
| Cost Factor | Renewables | Fossil Fuels |
|---|---|---|
| Upfront capital | High | Lower |
| Fuel cost | Near-zero (sun/wind is free) | High and volatile |
| Lifetime expenses | Predictable | Subject to commodity swings |
This structure makes renewables more cost-competitive as financing conditions improve and technology matures — once a plant is built, ongoing costs are largely fixed.
LCOE's Limitation:
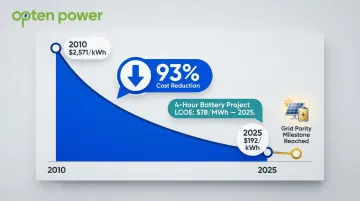
LCOE doesn't capture intermittency costs — the storage or backup capacity required when solar and wind output fluctuates. Industry estimates place these system-level additions at ₹415–1,245/MWh. Even so, renewables compare favorably: battery storage costs have collapsed by 93% since 2010, falling from ₹2,13,400/kWh to roughly ₹15,936/kWh, making the gap narrower every year.
Renewable vs. Fossil Fuel Costs: What the Numbers Actually Show
Global LCOE Benchmarks (2024-2025)
| Technology | IRENA 2024 Global Average ($/MWh) | Lazard 2025 Range ($/MWh) |
|---|---|---|
| Utility-Scale Solar PV | $43 | $38 – $78 |
| Onshore Wind | $34 | $37 – $109 |
| Offshore Wind | $79 | $70 – $157 |
| New Coal | $73 | $71 – $173 |
| Natural Gas (NGCC) | $85 | $48 – $109 |
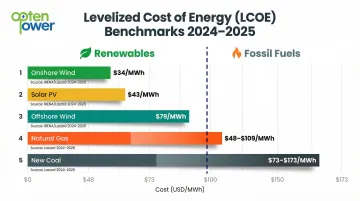
The data is unambiguous: solar PV and onshore wind now undercut new coal and gas on cost alone — before factoring in fuel price risk or carbon exposure.
Renewable Energy by Technology
Solar PV (Utility-Scale):
Solar has led the cost decline. The global weighted-average LCOE for utility-scale solar PV now stands at $43/MWh — a 90% drop since 2010. It is now the cheapest new source of electricity in a growing majority of markets worldwide.
In India, solar LCOE averages $38/MWh (approximately ₹3.16/kWh), below the global average — driven by high irradiation levels and competitive project tariffs.
Onshore Wind:
Onshore wind is the other cost leader, now mature and consistently below coal and gas in most regions. The current global LCOE is $34/MWh. Further reductions have been driven by:
- Larger rotor diameters capturing more wind
- Taller towers accessing stronger, steadier winds
- Improved capacity factors (percentage of time generating power)
- Turbine technology improvements that increase energy yields
Hydropower and Geothermal:
Both are established, reliable, and site-dependent:
- Hydropower is cost-competitive where water resources exist, offering firm baseload power at low marginal cost
- Geothermal provides stable baseload output at higher upfront cost, typically in the $60–100/MWh range depending on resource quality
The Fossil Fuel Side
Coal:
New coal plants are now more expensive per MWh than new solar or wind in most countries. The current LCOE range for coal is $73–173/MWh. Operating costs continue to rise as existing plants age and carbon costs increase. Globally, two-fifths of coal power stations are already running at a loss. In India, most coal plants operate at minimum technical loads of around 55%, forcing them to run even when lower-cost renewable electricity is available.
Natural Gas:
Natural gas LCOE has historically been competitive, ranging from $48–109/MWh. The critical differentiator, however, is price volatility — and the 2022–2023 period exposed just how severe that risk is.
Following Russia's invasion of Ukraine, gas prices doubled or tripled across multiple markets. European TTF spot prices averaged $13/MBtu in 2023 — two and a half times the 2016–2020 average. Asian spot LNG averaged $14/MBtu that same year, more than double its historical five-year norm. For energy-intensive buyers, that kind of exposure can wipe out years of cost savings.
Why Renewable Energy Costs Keep Falling
Wright's Law and Learning Curves
As cumulative production of a technology doubles, costs fall by a predictable percentage. Solar, wind, and battery storage have followed this pattern for decades. Solar PV has a learning rate of approximately 19.3–20%, meaning that with each doubling of installed capacity, prices fall by roughly 20%. This makes continued cost declines a structural expectation, not a temporary trend.
Manufacturing Scale and Supply Chain Maturity
Massive global manufacturing volumes have driven down equipment costs through:
- Automation in panel and turbine production
- Vertical integration of supply chains
- Component standardization
Between December 2009 and December 2023, crystalline silicon solar module prices declined by approximately 93%.
Battery Storage: From $2,571 to $192/kWh
Battery storage costs have fallen 93% over the past decade, from $2,571/kWh to $192/kWh. BloombergNEF reports that the global benchmark LCOE for a four-hour battery project fell to $78/MWh in 2025—a record low. Solar-plus-storage is now cost-competitive with fossil fuel peaker plants in a growing number of markets, effectively countering the intermittency argument that long shielded peaker plants from competition.
Improved Project Financing
As renewables have proven their reliability, the risk premium demanded by lenders has fallen, reducing the cost of capital and thus the LCOE. The Weighted Average Cost of Capital (WACC) is a primary differentiator in renewable LCOE across regions:
- Europe: 3.8% WACC
- India: 7.7% WACC
- Africa: 12.0% WACC
The IEA notes that moving from a 2% to 10% WACC raises the LCOE of a solar PV or onshore wind project by 80% — which means India's financing environment directly shapes the tariffs C&I buyers see. Green bonds and sustainability-linked loans are gradually expanding access to lower-cost capital in emerging markets.
Policy-Driven Competition
Competitive auction mechanisms — reverse auctions and tenders — have forced developers to sharpen bids aggressively, revealing the true floor price of renewables. Record-breaking results include:
- India: Multiple solar auctions have cleared below ₹2/kWh, with SECI tenders repeatedly setting domestic price benchmarks
- UAE: 2 GW Al Dhafra solar PV plant awarded at 1.35 US cents/kWh
- Saudi Arabia: 600 MW Shuaiba solar project awarded at 1.04 US cents/kWh
- Saudi Arabia: 400 MW Dumat Al Jandal onshore wind project awarded at 1.99 US cents/kWh
The India Context: Renewables Are Winning Here Too
The India Context: Renewables Are Winning Here Too
India's Record-Low Solar Tariffs
India now ranks among the world's most price-competitive renewable energy markets. Landmark solar auction results tell the story:
| Auction | Date | Technology | Capacity | Lowest Tariff (₹/kWh) |
|---|---|---|---|---|
| GUVNL (Gujarat) | Dec 2020 | Solar PV | 500 MW | ₹1.99 |
| SECI Tranche-III (Rajasthan) | Nov 2020 | Solar PV | 1,070 MW | ₹2.00 |
| RUMSL (Madhya Pradesh) | Q4 2024 | Solar PV | 170 MW | ₹2.15 |
| SECI Tranche-IX (ISTS) | Jun 2020 | Solar PV | 2 GW | ₹2.36 |
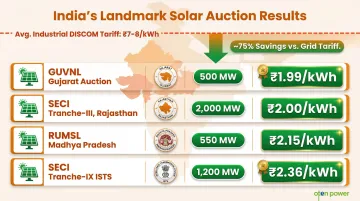
These tariffs consistently fall between ₹1.99 and ₹2.50/kWh—well below average grid tariffs for industrial consumers.
The DISCOM Tariff Problem for C&I
Large industrial consumers in India are often cross-subsidizing other consumer categories, pushing their actual cost of grid power far above generation cost alone:
- Maharashtra HT Industry (FY 2026-27): Energy charge of ₹8.44/kVAh plus demand charge of ₹650/kVA/month
- Tamil Nadu HT Industry (FY 2025-26): ₹7.50/kWh plus demand charge of ₹608/kVA/month
Renewable procurement via open access or PPAs bypasses this premium. The Cross-Subsidy Surcharge (CSS) in Maharashtra for HT Industry is ₹2.11/kWh, adding further cost burden to grid power.
State-Wise Variation and Opportunity
Renewable costs and regulatory frameworks vary across India's states. The highest-opportunity markets combine strong resource availability with policy support:
- Rajasthan & Gujarat — high solar irradiation, competitive open-access frameworks
- Tamil Nadu & Karnataka — established renewable infrastructure, active PPA market
- States with high DISCOM tariffs and favorable renewable policies deliver the greatest savings
Buyers in less favorable states still benefit, but the cost gap narrows depending on open-access charges and local grid tariffs.
The Volatility Hedge
Beyond upfront savings, there's a structural financial argument for renewables. Indian industrial buyers face unpredictable tariff revisions from state electricity regulatory commissions — revisions that have trended upward over time. Renewable PPAs lock in a fixed tariff for 10–25 years, giving procurement teams the budgeting certainty that grid power tied to fossil fuel prices cannot provide.
Platforms like Opten Power provide real-time DISCOM intelligence and standardized landing prices across 16 states, so C&I buyers can directly compare their current grid costs against live renewable PPA tariffs — with no back-and-forth with developers required.
What This Means for C&I Businesses: Turning Cost Data Into Action
From Cost Comparison to Procurement Strategy
Knowing renewables are cheaper is only the first step. The real question for C&I buyers is how to structure procurement to capture those savings. Main procurement routes include:
- Open access solar/wind: Direct procurement from renewable projects
- Rooftop solar: On-site generation for own consumption
- Corporate PPAs: Long-term contracts with developers
- Group captive: Shared ownership of renewable assets
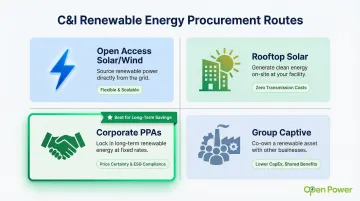
Among these, long-term PPAs offer the most bankable savings—and the clearest path to locking in unit costs before tariffs rise further.
The PPA Advantage for Energy-Intensive Industries
For heavy consumers—steel, cement, textiles, data centres, hospitals—a Corporate PPA can fix tariffs well below current DISCOM rates for a decade or more. That kind of cost certainty translates directly into better financial forecasting and stronger margins, regardless of what the grid does next.
Platforms like Opten Power let businesses compare PPA offers from multiple developers in real-time, with automated RFPs and pre-approved contracts that cut deal timelines by 50%. The faster a deal closes, the sooner that lower tariff starts working.
The Cost of Waiting
Speed matters beyond deal efficiency. India's regulatory landscape is tightening: the Carbon Credit Trading Scheme (CCTS) is taking shape, and Renewable Consumption Obligation (RCO) targets are scaling to 43.33% by 2029-30. Each year on fossil-fuel-based grid power adds to that compliance gap. Early renewable procurement is both a savings decision and a hedge against the costs building quietly on the sidelines.
Frequently Asked Questions
How do renewable energy costs compare to conventional energy costs?
On a levelized cost basis, utility-scale solar and onshore wind are now cheaper than new coal and gas plants in most markets globally. More than 90% of new renewable capacity added in 2024 undercut the cheapest fossil fuel alternative according to IRENA, with solar averaging $43/MWh and onshore wind $34/MWh globally.
What is the average cost of renewable energy?
Costs vary by technology and region. In India, solar LCOE averages approximately ₹3.16/kWh, with competitive auction tariffs reaching record lows of ₹1.99/kWh in Gujarat. Wind tariffs follow a similar downward trajectory across high-resource states.
Which renewable energy source is the most cost-effective?
Utility-scale solar PV and onshore wind are currently the most cost-effective renewable sources in most markets. Solar leads in high-irradiance regions like India, while onshore wind dominates in areas with strong, consistent wind resources.
Which renewable energy source is cheapest to produce?
Once built, solar and wind have near-zero fuel costs, making their marginal production cost zero. Their LCOE is driven almost entirely by upfront capital and financing costs, which have fallen dramatically over the past decade.
Which renewable energy source is most expensive to build?
Offshore wind carries the highest upfront capital costs due to marine installation complexity, followed by concentrated solar power (CSP) and deep-resource geothermal — though all three are seeing steady cost declines.