Introduction
For the first time in nearly a decade, global corporate clean energy procurement fell in 2025 — and for C&I energy buyers, that shift matters. Corporate power purchase agreements (cPPAs) are long-term contracts where businesses procure renewable energy directly from developers, letting companies lock in predictable energy prices while publicly advancing their decarbonization goals.
For the broader clean energy industry, each corporate deal signals demand strength, validates new project economics, and accelerates grid decarbonization.
According to BloombergNEF, total offsite clean energy procurement fell roughly 10% year-over-year to 55.9 GW in 2025 — ending a growth streak that began in 2016. India's C&I renewable market, while structurally different from Western markets, faces its own version of this recalibration: rising interconnection costs, grid curtailment risks, and evolving DISCOM regulations are reshaping how large buyers approach long-term energy contracts.
For C&I energy decision-makers, this inflection raises urgent questions: What structural forces drove the global pullback? Which buyers are still contracting at scale? And how should procurement strategies evolve to navigate 2026 and beyond?
Key Takeaways
- Global corporate clean energy procurement declined 10% in 2025 to 55.9 GW, the first drop since 2016
- Deal volume concentrated sharply — Meta, Amazon, Google, and Microsoft took 49% of all contracts, while unique US buyers fell 51%
- Hybrid PPAs (solar+storage, solar+wind) and nuclear deals are replacing standalone solar and wind contracts
- APAC volumes fell 35%, but India's corporate PPA demand is outpacing what regional figures reflect
- Passive procurement strategies are losing ground — data-driven buyers are locking in better pricing before supply tightens further
Global cPPA Market Records Its First Decline in Nearly a Decade
BloombergNEF's 1H 2026 Corporate Energy Market Outlook confirms that global offsite cPPA deals totaled approximately 55.9 GW across 712 agreements in 2025—down about 10% from the 2024 record. This marks the first year-over-year contraction since 2016.
Regional Performance Breakdown:
| Region | 2025 Volume | YoY Change | Key Drivers |
|---|---|---|---|
| Americas (US: 29.5 GW) | 32.1 GW | Flat (+0.5%) | Big Tech demand offset broader buyer pullback |
| EMEA | 17.0 GW | -13% | Negative power prices eroded standalone PPA economics |
| APAC | 6.9 GW | -35% | Policy uncertainty in India/South Korea; fewer mega-deals |
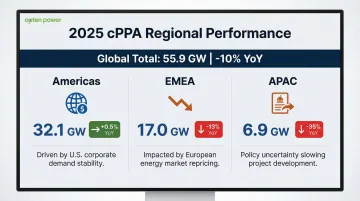
The Americas held steady on Big Tech hyperscaler demand alone. Europe and APAC contracted sharply — for reasons that go deeper than a single bad year.
Why the Contraction Happened
Two forces drove the 2025 pullback:
Negative power prices in Europe: In 2024, Finland saw negative wholesale prices for 8% of all hours (roughly 700 hours), Sweden for 7%, and the Netherlands and Germany for 5%. When prices go negative that frequently, standalone solar and wind PPAs lose financial logic — developers can't guarantee positive cash flows, and buyers absorb curtailment risk.
US policy uncertainty: The One Big Beautiful Bill Act (OBBBA) eliminates the Section 45Y and 48E clean electricity tax credits for projects placed in service after December 31, 2027, unless strict beginning-of-construction deadlines are met. On top of that, new AD/CVD tariffs on Southeast Asian solar imports hit up to 3,521% for certain Cambodian imports — pushing US utility-scale solar costs 54% above European levels. Project timelines stalled and PPA pricing climbed.
Even so, 2025 ranks as the second-highest year on record, and solar holds its position as the dominant cPPA technology globally. The pullback reflects specific policy and pricing shocks — not a structural reversal of corporate clean energy demand.
Big Tech Dominates as Smaller Buyers Pull Back
The Two-Speed Market
Meta, Amazon, Google, and Microsoft collectively contracted approximately 49% of all global cPPA capacity in 2025. Meta and Amazon alone accounted for over 20 GW combined. Meanwhile, the number of unique companies signing cPPAs in the US fell by roughly 51% year-over-year—from approximately 68 buyers in 2024 to just 33 in 2025.
The pattern is clear: hyperscalers are scaling up while smaller commercial and industrial (C&I) buyers are scaling back, priced out by rising complexity and tighter supply.
AI Data Centers Reshape Electricity Demand
Hyperscaler procurement is driven by AI-driven data center load growth. Lawrence Berkeley National Laboratory reports that US data center energy use reached 176 TWh in 2023 (4.4% of total US electricity). By 2028, that figure is projected to reach between 325 and 580 TWh—representing 6.7% to 12.0% of total US consumption. Globally, the IEA forecasts data center electricity consumption will double to approximately 945 TWh by 2030, with AI-accelerated servers growing 30% annually.
To meet this demand, hyperscalers are contracting nuclear PPAs, co-located generation, and long-term firm power deals that guarantee 24/7 supply.
Why Smaller Buyers Are Being Squeezed
That surge in hyperscaler demand is compressing the market for everyone else. Non-hyperscaler C&I buyers now face mounting challenges:
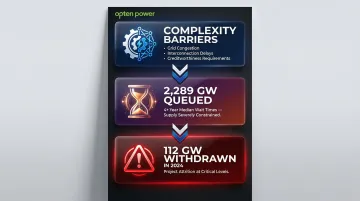
- Complexity barriers: Grid congestion, interconnection delays, and intricate contract structures demand creditworthiness and procurement expertise most mid-size buyers don't have in-house
- Supply constraints: At the end of 2024, approximately 10,300 projects representing 2,289 GW of capacity were seeking US grid interconnection, with median wait times exceeding 4 years
- Project attrition: A record 112 GW of solar and storage capacity withdrew from interconnection queues in 2024 due to tariff uncertainty and permitting challenges
For C&I buyers in competitive markets—including India's rapidly growing industrial and data centre sectors—these global supply pressures reinforce the need for structured procurement support and early-stage market access.
Hybrid and Firm Power Deals Become the New Standard
The Shift to Baseload-Like Contracts
BNEF tracked approximately 5.2 GW of baseload-like deals in 2025, including co-located solar+battery storage, combined solar+wind, and nuclear PPAs. Standalone solar and wind contracts are giving way to hybrid structures that deliver power around the clock.
GHG Protocol's Proposed Hourly Matching Rules
The GHG Protocol's proposed updates to Scope 2 emissions accounting are accelerating this shift. The revised standard—expected to be published in late 2027—will likely require:
- Hourly matching: Contractual instruments must be issued and redeemed for the same hour as energy consumption
- Geographic deliverability: Instruments must be sourced from the same market boundary where the buyer's operations are located
This means companies can no longer justify "100% renewable" labels based on annual RECs or time-shifted energy. Buyers must secure 24/7 clean energy solutions to maintain credible carbon claims.
Developer Response: Firm Power Products
As regulatory pressure tightens, developers are responding with supply-side solutions designed for continuous delivery. Seven of the top 10 cPPA sellers globally in 2025 offered some form of clean, firm power product. Engie, the top seller at approximately 3.6 GW, leads with its "24/7 Carbon-Free Energy" solution: a bundled approach combining PPAs, battery storage, and flexible assets to match consumption with clean generation every hour.
Why Heavy-Consumption Industries Are Driving This Trend
Data centers, steel, cement, and chemical manufacturers require reliable around-the-clock power. The era of buying cheap intermittent solar and calling it "green" is ending. For Indian C&I buyers operating under Round-the-Clock (RTC) power obligations—where supply must match load at every 15-minute time block—this global shift reinforces what regulators here are already demanding domestically.
Notable hyperscaler nuclear deals:
| Company | Partner | Capacity | Timeline |
|---|---|---|---|
| Microsoft | Constellation Energy | 835 MW | 20-year PPA to restart Three Mile Island Unit 1 by 2028 |
| Kairos Power | 500 MW total | SMR fleet by 2035; 50 MW Hermes 2 to TVA grid by 2030 |
India and APAC—Policy Uncertainty Alongside Real Growth
APAC's Statistical Illusion
APAC's reported 35% cPPA volume decline in 2025 was driven largely by an absence of mega-deals (contrast with Rio Tinto's 2+ GW Australian procurements in 2024) and policy uncertainty in India and South Korea—not a fundamental collapse in demand.
BNEF analysts estimate India's actual cPPA volume exceeds public data, given the prevalence of undisclosed bilateral deals.
Positive Signals Across the Region
Despite the headline decline, structural demand remains robust:
- Malaysia: Enhanced the Corporate Renewable Energy Supply Scheme (CRESS) in March 2025, capping wheeling charges at 45 sen/kWh for intermittent supply and 25 sen/kWh for firm supply with storage
- Japan: Corporate PPA market steadily maturing, with physical and virtual PPAs becoming effective methods for long-term environmental attribute procurement
- Australia: Demand remains strong across mining and heavy industry
- India: C&I buyers in steel, cement, textiles, and data centers are actively pursuing renewable procurement to manage energy costs
For Indian C&I buyers navigating this market, platforms like Opten Power provide access to 4+ GW of renewable capacity across 16 states, with real-time DISCOM intelligence that cuts through the opacity of bilateral deal-making.
India's Evolving Regulatory Environment
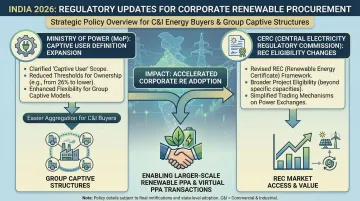
Two significant regulatory changes in 2026 have improved the commercial viability of renewable procurement for Indian corporate groups:
- Ministry of Power — 2026 Electricity (Amendment) Rules: Broadened the definition of "captive user" so that a company's subsidiaries and holding companies are treated as a single captive entity. This legitimizes group captive structures and allows collective consumption to qualify for surcharge exemptions.
- CERC — REC Eligibility Expansion: Extended Renewable Energy Certificate eligibility to captive generating stations, opening additional pathways for both regulatory compliance and revenue generation.
What's Driving These Corporate PPA Trends in 2026
AI and Data Center Electricity Demand
Surging compute workloads are rewriting the cPPA market. Hyperscalers are now signing multi-gigawatt clean energy deals — driving up demand, tightening supply, and pushing pricing structures into new territory across every major market.
Negative Power Prices and Evolving Carbon Accounting
Stricter carbon accounting expectations — including movement toward 24/7 carbon-free energy tracking — are raising the bar for what qualifies as meaningful clean procurement. Simple PPAs no longer satisfy scrutiny from regulators, investors, or enterprise sustainability teams. The market is shifting toward firm, time-matched renewable supply.
Rising Grid Tariffs and Open Access Barriers
For C&I buyers, proactive energy procurement has become a financial imperative. Rising DISCOM tariffs, open access approval delays across states, and intensifying competition for renewable capacity all create real cost and supply risk for businesses that move slowly.
Key pressure points driving procurement urgency include:
- DISCOM tariff escalation — grid power costs continue rising, widening the savings gap with renewable alternatives
- Open access bottlenecks — state-level approval timelines and regulatory inconsistencies slow deal execution
- Capacity competition — quality renewable projects in key states are getting absorbed faster
Opten Power's platform addresses this directly — with real-time DISCOM tariff intelligence, automated RFP tools, and instant IRR analysis that help energy teams move from evaluation to signed agreement faster.
Future Signals: What to Watch in Corporate Clean Energy Through 2027
Top Emerging Signals to Track
- Track whether GHG Protocol Scope 2 hourly-matching rules are formally adopted by late 2027 — adoption pace will directly set the timeline for firm power procurement mandates in India and globally.
- Watch firm power pricing: co-located solar+storage, hybrid wind+solar, and small modular reactors need to reach cost parity with standalone solar PPAs before they displace them at scale.
- Monitor non-tech C&I buyer re-entry — manufacturing, heavy industry, and commercial real estate sectors remain largely absent from the cPPA market; lower transaction barriers and transparent deal structures are the most likely triggers for their return.
- Note how procurement platforms evolve: automated RFPs, real-time tariff intelligence, and portfolio dashboards are reducing deal complexity and opening the market to buyers who previously found it inaccessible.
1–3 Year Outlook
Corporate clean energy volumes will stay subdued until firm power costs fall meaningfully or non-tech buyers enter at scale — neither is guaranteed in the next 12 months. In India, where baseline procurement infrastructure is still being built, the growth ceiling is structurally higher than in mature markets. Tightening ESG reporting mandates and rising energy costs are already compressing that timeline.
That window rewards early movers. Businesses that build procurement intelligence now — with real-time tariff data, automated RFPs, pre-approved contracts, and portfolio dashboards — will close deals faster and at better rates when supply competition intensifies.
Frequently Asked Questions
What are the typical PPA solar rates?
Solar PPA rates vary by region, project size, and contract structure. In India, recent 2024–2025 SECI tenders placed solar+storage tariffs at ₹3.52–₹3.53/kWh, with India's utility-scale LCOE reaching $0.038 USD/kWh. Globally, IRENA reports the weighted average LCOE for utility-scale solar stabilized at $0.043 USD/kWh in 2024.
How do you price a PPA?
PPA pricing is determined by the levelized cost of energy (LCOE) of the project, contract duration, off-take risk, transmission and wheeling charges, and regulatory costs. Buyers can use platforms or advisors to compare real-time offers across multiple developers and states.
What is the price per kilowatt hour for wind power?
Wind power tariffs vary by site wind resource quality, project vintage, and grid zone. In India, recent SECI tenders for 1.2 GW of wind capacity placed tariffs at ₹3.67–₹3.69/kWh. Globally, IRENA reports onshore wind LCOE fell to $0.034 USD/kWh in 2024, making it the cheapest renewable source.
What are renewable assets?
Renewable assets are power generation projects—solar, wind, hydro, geothermal, biomass, and increasingly nuclear—that produce electricity with little to no greenhouse gas emissions. In the context of corporate PPAs, these are the projects that companies contract with to procure clean energy.
What does BloombergNEF stand for?
BloombergNEF (BNEF) stands for Bloomberg New Energy Finance. It is a leading research and data provider specializing in clean energy, advanced transport, digital industry, and commodities markets—and a primary source for global corporate PPA market data.
Is BloombergNEF a reliable source?
BloombergNEF is one of the most cited sources for clean energy market data, referenced by governments, developers, investors, and media worldwide. Their corporate PPA figures draw from publicly disclosed deals and direct market participant submissions, though data may be revised as new information emerges.