Introduction
Solar tariffs in India have fallen over 80% in the past decade—from ₹10.95/kWh in 2010 to currently around ₹2.48–₹2.55/kWh. Yet despite this cost reduction, commercial and industrial buyers still struggle to answer a simple question: which renewable source gives them the best cost advantage?
The challenge lies not in generation costs alone, but in the complexity of what a business actually pays per unit. Wheeling charges, banking fees, cross-subsidy surcharges, and state-specific DISCOM regulations can add ₹1–₹3/kWh or more to the base tariff, transforming an apparently cheap power purchase agreement into an expensive proposition.
This article provides a practical cost comparison of utility-scale solar, onshore wind, and hybrid renewable energy sources in India. You'll come away knowing current benchmark costs, how each technology stacks up, what drives price differences, and how renewables compare to conventional grid power—giving you the clarity to make confident procurement decisions.
TLDR: Key Takeaways
- Solar PV tariffs consistently range ₹2.48–2.55/kWh; onshore wind is comparably priced but highly site-dependent
- Hybrid projects offer improved capacity utilisation and round-the-clock supply, though tariffs carry a modest premium
- The cheapest source on paper is rarely cheapest in practice—state charges reshape final unit prices
- Renewable energy already undercuts new coal on generation cost—and the gap widens once health and carbon costs are factored in
- For C&I buyers, Corporate PPAs matched to specific load profiles and states consistently outperform generic cost benchmarks
Current Costs of Renewable Energy Sources in India
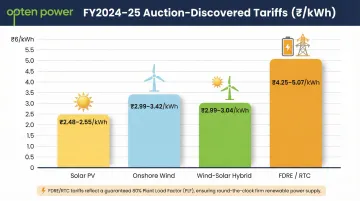
Auction-Discovered Tariffs (FY2024–FY2025)
India's renewable energy tariffs are primarily discovered through competitive auctions conducted by central agencies like SECI (Solar Energy Corporation of India), NTPC, and state utilities. Recent auction results reveal a clear pricing hierarchy:
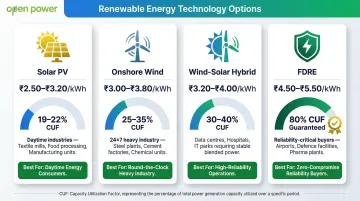
Utility-scale solar PV has stabilised at ₹2.48–₹2.55/kWh across major tenders. SECI's 1.2 GW solar auction in 2024 saw tariffs of ₹2.48–₹2.49/kWh, while GUVNL's 600 MW auction discovered tariffs of ₹2.54–₹2.55/kWh.
Onshore wind tariffs range ₹2.99–₹3.42/kWh depending on wind zone quality and tender specifics. GUVNL's 200 MW hybrid auction discovered wind-solar tariffs at ₹2.99–₹3.04/kWh, while standalone wind auctions have cleared at ₹3.42/kWh.
Firm and Dispatchable Renewable Energy (FDRE) projects—which combine oversized solar/wind with battery storage to guarantee supply at approximately 80% plant load factor—carry tariffs well above standard renewables. SJVN's 1.2 GW FDRE tender cleared at ₹4.25–₹4.26/kWh, while NTPC's 760 MW FDRE auction saw tariffs of ₹4.69–₹4.70/kWh.
Understanding LCOE: The True Cost Lens
Levelised Cost of Electricity (LCOE) is the correct lens for comparing technologies. It accounts for total capital cost, operating expenses, financing cost, and generation output over a project's lifetime—typically 25 years.
Auction tariffs and LCOE are related but not identical. Auction tariffs reflect what developers bid to supply power under specific contract terms, incorporating their financing costs, risk premiums, and profit expectations. LCOE, by contrast, is an analytical metric that normalizes all costs to a per-unit basis.
On both metrics, India stands out. IRENA's 2024 analysis reports:
- Solar PV LCOE: $0.038/kWh (~₹3.20/kWh)
- Onshore wind LCOE: $0.048/kWh (~₹4.05/kWh)
These figures place India among the most cost-competitive renewable markets worldwide.
Installed Cost Benchmarks
Total installed cost (TIC) per MW varies widely by technology:
- Utility-scale solar PV: ₹4.5–₹5 crore/MW for commercial installations
- Onshore wind: ₹7.9 crore/MW according to CERC's 2024 draft regulations
- Small hydro: ₹8.9–₹12 crore/MW (CERC benchmark)
- Biomass: ₹5.62–₹7.44 crore/MW (CERC benchmark)
Solar has historically had lower TIC than wind per MW, but wind achieves higher capacity utilisation factors in good wind zones—meaning more units generated per rupee of capital expenditure.
The Financing Cost Factor
Financing costs are a major LCOE driver in India. Research from Oxford Sustainable Finance shows debt costs for greenfield solar and wind projects currently range 8.5–9.75%, with Power Finance Corporation lending rates at 8.95–9.70%.
This is well above the 3–5% financing rates common in developed markets. The RBI's recent repo rate cut to 6.25% in February 2025 signals a favourable easing cycle, potentially reducing future project financing costs.
Solar, Wind, and Hybrid Power: A Direct Cost Comparison
| Technology | Generation Tariff Range | Capacity Utilisation Factor (CUF) | Best Suited For |
|---|---|---|---|
| Solar PV | ₹2.48–₹2.55/kWh | 19–22% | Manufacturing units, warehouses, commercial complexes with predictable daytime loads |
| Onshore Wind | ₹2.99–₹3.42/kWh | 25–35% (in good zones) | Heavy industries with 24×7 operations requiring base load power |
| Wind-Solar Hybrid | ₹2.99–₹3.04/kWh | 30–40% | Data centres, hospitals, process industries needing improved round-the-clock generation |
| FDRE/RTC | ₹4.25–₹5.07/kWh | ~80% (guaranteed) | Industries requiring dispatchable, grid-equivalent reliability |
Why Wind Can Be Cheaper Despite Similar Tariffs
Onshore wind delivers more value per rupee of capital in high-wind zones despite tariffs appearing similar to solar. The reason lies in capacity utilisation.
High-potential wind zones in Tamil Nadu, Karnataka, Gujarat, Andhra Pradesh, and Maharashtra achieve CUFs greater than 35%, according to India's Wind Potential Atlas. Solar installations typically achieve 19–22% CUF, while hybrid projects reach 30–40%.
Higher CUF means more units generated per rupee of capital expenditure. A wind project at ₹3.00/kWh with 35% CUF delivers more annual energy—and better project economics—than a solar project at ₹2.50/kWh with 20% CUF, assuming similar capital costs.
The Growing Role of Hybrid Tenders
Energy offtakers now prefer less intermittent power profiles. IEEFA's tendering trends analysis shows hybrid tender share grew from 16% in FY2020 to 43% in FY2024.
Hybrid projects combine solar's daytime peak generation with wind's stronger nighttime and monsoon generation, offering more predictable generation across hours of the day. This reduces backup power costs for 24×7 industrial consumers, offsetting the modest tariff premium hybrid projects command.
The Cost of Firm, Dispatchable Power
FDRE projects guarantee supply at approximately 80% plant load factor by combining oversized solar/wind capacity with battery storage. As of late 2024, FDRE tender activity reached 17.3 GW tendered with 6.0 GW awarded.
First-year FDRE tariffs currently range ₹4.25–₹5.07/kWh—substantially higher than variable solar or wind. For industries with high demand charges, power factor penalties, or reliability requirements, the effective cost gap narrows considerably once grid-side costs are factored in.
C&I buyers evaluating these options can use Opten Power to compare live tariffs across solar, wind, and hybrid projects from India's top producers, with IRR, payback, and regulatory analysis generated in real time.
Beyond the Tariff: Hidden Costs Businesses Often Miss
State-Level Charges That Reshape Costs
The generation tariff is only the starting point. For open-access or PPA-based renewable transactions, buyers face additional charges that vary significantly by state:
- Wheeling and transmission charges: Fees for using DISCOM infrastructure to transport power
- Banking charges: Costs for storing surplus generation with the DISCOM for later withdrawal
- Cross-subsidy surcharge (CSS): Levy to compensate DISCOMs for lost cross-subsidy revenue
- Additional surcharge (AS): Charge to cover DISCOM fixed costs
- DISCOM-specific levies: State-dependent charges and regulatory fees
These charges can add ₹1–₹3/kWh or more to the effective cost. State-specific examples include:
| State | Key Open Access Charges (FY24-25) |
|---|---|
| Maharashtra | HT Wheeling: ₹0.80/kWh; LT Wheeling: ₹2.76/kWh |
| Tamil Nadu | HT Wheeling: ₹1.04/kWh; CSS: ₹1.92/kWh |
| Telangana | Additional Surcharge: ₹1.09/kWh; T&D Charges: ₹0.84/kWh |
| Gujarat | Additional Surcharge: ₹0.93/kWh |
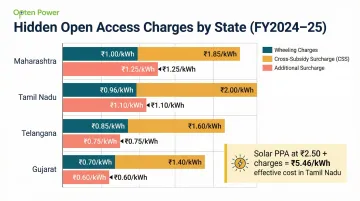
A solar PPA at ₹2.50/kWh in Tamil Nadu could carry an effective landed cost of ₹5.46/kWh after adding wheeling (₹1.04) and CSS (₹1.92) — nearly double the headline tariff.
Deviation Settlement Mechanism (DSM) Penalties
CERC's amended DSM regulations, effective December 2024, impose stricter forecasting requirements on variable renewable generators.
Generators without adequate forecasting or storage buffers face revenue losses rising by an estimated 60–70% under the new framework. For C&I buyers under certain PPA structures, that generator exposure flows upstream — showing up as reduced generation availability or tariff adjustments in the contract.
Financing Cost Differentials
According to Oxford Sustainable Finance research, central government intermediaries like SECI achieve approximately 6% lower bid prices through sovereign credit backing. Buyers procuring via state DISCOMs typically pay a premium reflecting higher perceived counterparty risk.
Why Renewable Energy Costs Vary Across States in India
Resource Quality: The Primary Driver
Solar and wind resource quality varies dramatically across India. The country's best solar zones—Rajasthan and Gujarat—achieve capacity utilisation factors of 21–25%, while wind-rich states like Tamil Nadu and Karnataka see CUFs of 30–35% for onshore wind.
Higher CUF directly lowers LCOE. A project in a high-resource zone generates more units from the same capital investment, reducing the per-unit cost even if the tariff appears similar.
DISCOM Financial Health and Counterparty Risk
State utilities' financial health materially affects the effective cost of renewable energy. PFC's 13th Integrated Rating report shows DISCOMs carry accumulated debt of ₹6.84 trillion, with outstanding loans of ₹7.53 lakh crore as of March 2024.
DISCOM payment delays averaging 6+ months create counterparty risk that gets priced into tariffs for state-tendered projects. Gujarat is generally considered lower-risk for PPA execution, while several other states carry higher counterparty risk premiums.
The Regulatory Patchwork
Open-access charges, Renewable Purchase Obligation (RPO) compliance frameworks, and state-level renewable energy policies create a patchwork of effective costs. A solar PPA that appears cheap in one state may be more expensive than grid power after factoring in state-specific surcharges.
Accurate landed cost comparison requires real-time DISCOM intelligence covering state-specific surcharges and regulatory obligations — the kind of analysis Opten Power standardises across 16 states. Buyers who skip this step routinely underestimate total procurement costs.
Transmission and Grid Evacuation Constraints
Over 50 GW of auctioned renewable capacity remains stalled partly due to inadequate transmission infrastructure. Projects in transmission-constrained zones face curtailment risk, which increases effective cost per unit delivered.
Grid evacuation bottlenecks hit certain states harder than others. The cost impact doesn't appear in generation tariffs — but it shows up directly in project viability and buyer economics through:
- Reduced units delivered relative to contracted capacity
- Higher effective LCOE despite competitive headline tariffs
- Increased offtake uncertainty for long-term PPAs
How Renewable Energy Costs Compare to Coal and Grid Tariffs
Renewable Energy Is Already Cheaper Than New Coal
New utility-scale solar and wind in India are now cheaper than new coal on a generation cost basis. When social costs are factored in, the gap widens significantly.
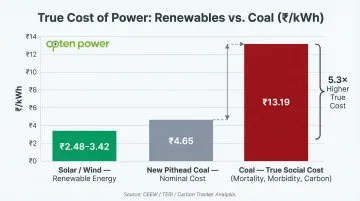
IISD's "Budgeting for Net Zero" report estimates that while the nominal procurement cost of new pithead coal is ₹4.65/kWh, factoring in mortality, morbidity, and carbon costs raises coal's true social cost to ₹13.19/kWh.
Solar and wind at ₹2.48–₹3.42/kWh deliver a clear cost advantage — and a substantial reduction in public health and carbon impacts.
| Source | Generation Cost (₹/kWh) |
|---|---|
| Solar / Wind | ₹2.48 – ₹3.42 |
| New Pithead Coal (nominal) | ₹4.65 |
| Coal (including social costs) | ₹13.19 |
FDRE Approaching Parity by 2030
Firm and Dispatchable Renewable Energy (FDRE) is projected to undercut new coal by 2030, provided 50% of surplus generation can be sold in the open market — a realistic threshold given India's growing power exchange volumes.
For industries with high daytime loads, even non-firm solar or wind PPAs can cover 60–80% of consumption at well below grid tariff.
Comparing to Industrial Grid Tariffs
C&I buyers face steep HT industrial energy charges from state DISCOMs:
- Maharashtra: ₹7.51/kWh (HT Industry)
- Telangana: ₹7.65/kWh (HT Industry General, 11kV)
- Tamil Nadu: ₹7.25/kWh (HT Industry)
A well-structured renewable PPA at ₹3.50–₹5.00/kWh effective landed cost (after state charges) represents savings of 30–40% for most large C&I consumers — with price certainty locked in over a 10–25 year contract term.
Frequently Asked Questions
What is the cost of a renewable energy plant in India?
Utility-scale solar installations require approximately ₹4.5–₹5 crore/MW total installed cost, while onshore wind costs around ₹7.9 crore/MW. Hybrid projects fall between these ranges. Costs vary considerably by project size, location, grid connectivity requirements, and technology choice.
What are the cheapest and most expensive renewable energy sources in India?
Onshore wind and solar PV are currently the cheapest utility-scale options, with auction tariffs in the ₹2.48–₹3.42/kWh range. Offshore wind and large hydro are the most expensive due to higher capital costs, complex execution, and longer development timelines.
How much does a 1 MW wind power plant cost in India?
A 1 MW onshore wind installation costs approximately ₹7.9 crore total project cost, based on CERC benchmarks. Actual costs vary by wind zone quality, turbine selection, and land and grid connectivity expenses.
Is solar or wind energy cheaper in India?
Both are similarly priced at the tariff level (₹2.48–₹3.42/kWh), but wind can deliver more units per rupee of capital in high-wind zones due to CUFs of 30–35% versus solar's 19–22%. Solar is more predictable and available across more states, making it better suited for industries with distributed facilities or daytime-heavy consumption patterns.
How do renewable energy costs in India compare to coal?
New solar and wind are already cheaper than new coal on generation cost (₹2.48–₹3.42/kWh versus ₹4.65/kWh). When health, pollution, and carbon externalities are included, coal's true cost reaches ₹13.19/kWh, making renewables significantly cheaper on a fully-loaded basis.
What is a Corporate PPA and how can it reduce my energy costs?
A Corporate PPA is a direct long-term power purchase agreement between an industrial or commercial buyer and a renewable energy developer. It locks in below-grid tariffs for 10–25 years, cutting energy costs by up to 30–40% compared to DISCOM grid supply. Buyers also gain long-term tariff certainty and verifiable sustainability credentials.