Introduction
Indian industries face unprecedented energy cost pressure in 2026. Grid tariffs in coal-heavy states like Maharashtra have hit ₹10.17/kWh, while imported coal prices remain 17% above pre-pandemic baselines despite recent moderation. New compliance obligations under India's Carbon Credit Trading Scheme (CCTS) and escalating Renewable Purchase Obligation (RPO) targets—now at 29.91% for FY2024-25—are forcing commercial and industrial consumers to fundamentally rethink their power sourcing strategy.
Yet headline tariff numbers tell only part of the story. Fuel surcharge adjustments can add up to ₹2.85/kWh to base rates in states like Chhattisgarh, and cross-subsidy surcharges for open access users range from ₹0.64 to ₹2.11/kWh depending on voltage level and state.
For C&I businesses evaluating long-term energy procurement, the full landed cost—not the published tariff—is what determines real competitiveness. This guide breaks down both coal and renewable costs component by component, covering grid tariffs, surcharges, compliance costs, and procurement structures, so decision-makers can compare on equal terms.
Key Takeaways
- Solar and wind PPAs now cost ₹2.68–₹3.60/kWh vs. ₹7.15–₹10.17/kWh from coal-heavy grid power in most industrial states
- Coal's landed cost runs higher than listed tariffs — fuel surcharge adjustments (up to ₹2.85/kWh), cross-subsidy charges, and carbon penalties add up fast
- Renewable PPAs offer 15–25 year price certainty; coal cannot match this due to fuel volatility
- Hybrid solar-wind projects with storage now achieve 50%+ capacity utilization, closing coal's dispatchability advantage
- Most C&I businesses can switch to renewable PPAs with immediate per-unit savings and no upfront capital outlay
Coal vs. Renewable Energy: Quick Comparison
| Dimension | Coal-Based Grid Power | Renewable Energy (Solar/Wind PPAs) |
|---|---|---|
| Levelized Cost (₹/kWh) | ₹7.15–₹10.17 including surcharges; LCOE ~₹6.1 | Solar: ₹2.68–₹2.74; Wind/Hybrid: ₹3.25–₹3.60; Solar + Storage: ₹3.41–₹3.42 |
| Price Predictability | High volatility—fuel surcharges fluctuate quarterly; imported coal swung 22% in 2024-2025 alone | Fixed tariff for 15–25 years with zero fuel cost risk |
| Compliance Costs | RPO penalties up to ₹10 lakh; CCTS obligations across 9 energy-intensive sectors; PAT Cycle VII targets | Zero carbon compliance costs; earns RPO credits; meets ESG mandates |
| Dispatchability | 24x7 availability; no intermittency concerns | Solar: daytime only; Hybrid with storage: 50%+ CUF with peak power delivery; partial grid backup viable |
| Carbon & ESG Impact | 74% of India's generation in FY 2023-24; declining to 66% by 2027 under IEA projections | Zero operational emissions; aligns with RE100 commitments and global supply chain requirements |
| Levelized Cost (₹/kWh) | ₹7.15–₹10.17 including surcharges; LCOE ~₹6.1 | Solar: ₹2.68–₹2.74; Wind/Hybrid: ₹3.25–₹3.60; Solar + Storage: ₹3.41–₹3.42 | | Price Predictability | High volatility—fuel surcharges fluctuate quarterly; imported coal swung 22% in 2024–2025 alone | Fixed tariff for 15–25 years with zero fuel cost risk | | Compliance Costs | RPO penalties up to ₹10 lakh; CCTS obligations across 9 energy-intensive sectors; PAT Cycle VII targets | Zero carbon compliance costs; earns RPO credits; meets ESG mandates | | Dispatchability | 24x7 availability; no intermittency concerns | Solar: daytime only; Hybrid with storage: 50%+ CUF with peak power delivery; partial grid backup viable | | Carbon & ESG Impact | 74% of India's generation in FY 2023-24; declining to 66% by 2027 under IEA projections | Zero operational emissions; aligns with RE100 commitments and global supply chain requirements |
What is Coal Power?
Coal-based power generation in India refers to thermal power plants that burn domestic or imported coal to produce electricity, feeding the national grid and captive industrial installations. For decades, coal has been the default energy source for heavy industries—steel, cement, textiles, and continuous-process manufacturing—because of its perceived reliability and historically low fuel costs.
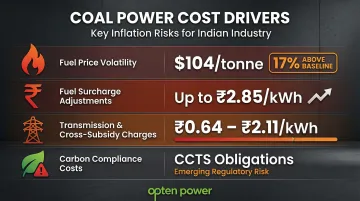
The cost picture today looks very different. Four factors now drive actual coal power costs for industrial consumers:
- Fuel price volatility: Imported coal (Newcastle benchmark) averaged $104/tonne in 2025—still 17% above the 2017–2019 baseline of $89/tonne. Supply constraints force many consumers to blend costlier imported coal at spot prices.
- Fuel surcharge adjustments: Base tariffs don't reflect true costs. In Chhattisgarh, FPPPA charges added ₹2.85/kWh on top of base rates in FY2024-25—making quarterly budgeting unpredictable for finance teams.
- Transmission and cross-subsidy charges: Industrial consumers pay surcharges ranging from ₹0.64/kWh (Chhattisgarh, 220/132kV) to ₹2.11/kWh (Maharashtra, HT category), plus wheeling charges of ₹0.27–₹0.60/kVAh by state.
- Carbon compliance costs: India's Carbon Credit Trading Scheme (notified June 2023) targets nine energy-intensive sectors. Obligated entities must meet GHG intensity reduction norms or purchase Carbon Credit Certificates—an emerging cost line that didn't exist three years ago.
Use Cases of Coal Power
Coal-sourced power remains dominant in industries requiring round-the-clock, high-load-factor operations where interruption risk is unacceptable. Sponge iron plants, large-scale cement kilns, and continuous textile manufacturing still rely heavily on coal-based grid or captive generation because renewable intermittency—without adequate storage—poses operational risks.
That dominance is eroding. Key projections show the pace of change:
- Coal generated 74% of India's electricity in FY2023-24
- The IEA forecasts this share drops to 66% by 2027
- The Central Electricity Authority projects coal's installed capacity share falls to 35.6% by March 2030, as non-fossil sources reach 64.4%
The structural shift is already underway—and the cost comparison with renewables is a central reason why.
What is Renewable Energy?
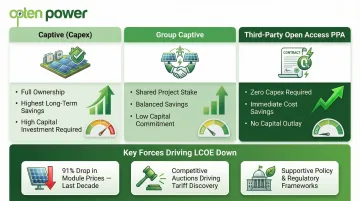
Renewable energy for Indian industrial consumers primarily means utility-scale solar, wind, and solar-wind hybrid projects delivered via open access or Corporate Power Purchase Agreements (PPAs). Buyers procure renewable power through three main models:
- Captive (Capex): Full equity ownership of the asset; maximizes long-term savings but requires upfront capital deployment
- Group Captive (Group-Capex): Minimal equity stake in a shared project; balances cost savings with lower capital commitment across multiple consumers
- Third-Party Open Access: Zero upfront capital; buyer signs a long-term PPA with an independent power producer and pays per unit consumed
Three forces drove renewable LCOE to its current lows:
- Solar module prices dropped 91% between 2010 and 2024, slashing project costs at the hardware level
- Competitive reverse auctions by SECI and state utilities pushed tariff discovery to record lows
- Policy support — including Renewable Purchase Obligation (RPO) targets and the Green Energy Open Access Rules (2022) — cut the eligibility threshold from 1 MW to 100 kW, opening the market to mid-size industrial consumers
By December 2024, over 37,558 Green Energy Open Access applications had been approved, representing 19,892 MU of energy.
Recent SECI auctions have driven tariffs to levels that are directly competitive with — or cheaper than — coal-based grid supply for most industrial consumers:
- Utility-scale solar: ₹2.68–₹2.74/kWh (ISTS-XIV, January 2024)
- Wind-solar hybrid: ₹3.25–₹3.28/kWh (Tranche IX, October 2024)
- Solar with storage: ₹3.41–₹3.42/kWh (Tranche XV)
Use Cases of Renewable Energy
With tariffs this competitive, renewables now dominate procurement decisions across a wide range of industrial profiles. Industries with significant daytime loads or ESG mandates — IT parks, data centers, commercial complexes, textile mills, and manufacturing units — have led adoption. Solar-wind hybrid projects with storage have extended viability to 24x7 industrial loads previously considered unsuitable for renewables.
Platforms like Opten Power give C&I buyers access to 4+ GW of ready renewable capacity across solar, wind, and hybrid projects in 16 states. Buyers can compare tariffs, run instant IRR and payback analysis, and assess regulatory impacts across pre-vetted developers in real-time — cutting procurement timelines from months to days.
The Full Cost Breakdown: Coal vs. Renewables in 2026
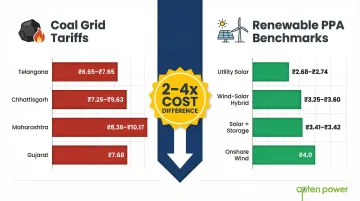
The numbers below tell a clear story: grid tariffs from coal-heavy states are running 2–4x the cost of renewable PPAs signed in the same period. Here's what industrial buyers are actually paying.
Effective Per-Unit Costs
Industrial Grid Tariffs (Coal-Heavy States):
- Telangana: ₹6.65–₹7.65/kVAh depending on voltage level
- Chhattisgarh: ₹7.25/kWh (HV Steel); ₹9.63/kWh (Other Industrial)
- Maharashtra: ₹8.36/kVAh base (FY2024-25); projected ₹10.17/kWh in FY2025
- Gujarat: ₹7.68/kWh projected for FY2025
Renewable PPA Benchmarks:
- Utility-scale solar: ₹2.68–₹2.74/kWh (SECI ISTS-XIV, GUVNL auctions)
- Wind-solar hybrid: ₹3.25–₹3.60/kWh (SECI Tranche IX, MSEDCL)
- Solar + storage: ₹3.41–₹3.42/kWh (SECI Tranche XV)
- Onshore wind: ₹4.0/kWh LCOE globally
Hidden Costs of Coal That Inflate True Costs
Beyond headline tariffs, coal power carries substantial hidden costs:
Fuel Surcharge Volatility: Imported coal prices swung 22% between 2024 and 2025 alone, translating to quarterly FPPPA adjustments that can add ₹2.85/kWh in states like Chhattisgarh. For a medium-sized manufacturer consuming 10 million units annually, a ₹1/kWh fuel surcharge increase costs ₹1 crore in unbudgeted expenses.
Open Access Surcharges: Industrial consumers accessing grid power pay:
- Cross-subsidy surcharge: ₹0.64–₹2.11/kWh depending on state and voltage
- Wheeling charges: ₹0.27–₹0.60/kVAh
- Standby charges: 10% of applicable energy charge in Telangana
Carbon Compliance Penalties: Under the Energy Conservation Act 2001 (Section 26(3)), RPO non-compliance penalties reach ₹10 lakh plus twice the price of every metric ton of oil equivalent in excess. CCTS obligations for nine energy-intensive sectors add tradable Carbon Credit Certificate requirements, creating a new cost layer absent in renewable procurement.
Renewable PPA Cost Structure
A Corporate PPA shifts the cost equation entirely:
- Zero fuel cost: No exposure to coal price volatility
- Fixed tariff: Locked in for 15–25 years, enabling accurate long-term budgeting
- Open access charges apply: But net savings vs. grid supply still reach ₹3–5/kWh in most states
- Compounding savings: A ₹4/kWh savings on 10 million units annually equals ₹4 crore saved per year, ₹60 crore over 15 years
Capital vs. Operational Cost Dynamics
Those ₹4 crore annual savings stem from a fundamental difference in how each energy model is structured financially. Coal power keeps upfront grid costs low but imposes high, variable operating costs subject to fuel price swings and regulatory penalties.
Renewable PPAs flip this: Corporate PPAs require zero capex from the buyer while locking in predictable long-term contracts. For captive solar or wind, upfront capex is offset by IRRs of 14–18% over the project life — with payback periods of 4–7 years for captive projects and 1–3 years for group captive models, calculated against the consumer's variable grid tariff.
The Regulatory Cost Layer
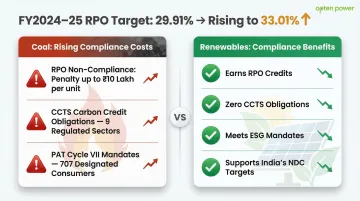
India's CCTS, PAT schemes, and RPO targets create rising compliance costs specific to coal. FY2024-25 RPO targets hit 29.91%, climbing to 33.01% in FY2025-26. Industries relying heavily on coal face:
- Non-compliance penalties up to ₹10 lakh plus excess consumption penalties
- Carbon credit purchase obligations under CCTS for nine sectors
- PAT Cycle VII mandates for 707 Designated Consumers
Renewable-sourced power avoids these entirely, earning RPO credits instead of penalties.
Global Context Validation
The U.S. Energy Information Administration's 2026 outlook projects solar capacity to increase 22% year-over-year (from 140 GW in 2025 to 171 GW in 2026), while global coal-fired power generation will peak around 2025 before declining steadily. Indian C&I buyers are already on the right side of that curve — renewable PPAs are consistently undercutting coal grid tariffs by ₹3–5/kWh, and that gap widens every time a fuel surcharge adjustment hits.
Which Energy Source is Right for Your Business?
Decision Framework by Load Profile
Daytime-Dominant Loads (Commercial Complexes, IT Parks, Warehouses): Solar PPAs are the lowest-cost option with the fastest payback. With tariffs at ₹2.68–₹2.74/kWh vs. grid rates of ₹9–₹10/kWh, payback periods drop to 1–3 years under group captive models.
Round-the-Clock Heavy Industrial Loads (Steel, Cement, Data Centers): Solar-wind hybrid projects with storage or complementary grid backup meet 24x7 requirements. SECI's Tranche VI hybrid projects mandate 50%+ annual capacity utilization factors, with peak power delivery of up to 4,000 kWh per MW rated capacity during specified hours. Solar + storage auctions (Tranche XV) discovered tariffs at ₹3.41–₹3.42/kWh—still 50–65% cheaper than coal-heavy grid tariffs.
Transitional Loads or Constrained Open Access Zones: Blend grid power with renewable PPAs for partial offsite supply. Start with 30–50% renewable replacement, measure savings, and scale up as confidence builds.
Addressing the Reliability Question
Coal's dispatchability advantage is real for industries that cannot tolerate interruption. Hybrid renewable projects with adequately sized storage or grid backup now meet this requirement. SECI Tranche VI projects achieve 50%+ CUF with contractual obligations for peak power delivery. Hybrid designs can serve base load industrial applications that were previously considered renewable-incompatible.
ESG and Business Case Alignment
Corporate sustainability mandates are no longer optional. Over 400 RE100 member companies globally have committed to 100% renewable electricity. If all meet their targets through renewable PPAs, it will catalyze 105–110 GW of additional capacity between 2026 and 2030.
In India, direct renewable procurement by C&I consumers rose from 4% in FY2019 to 7.4% in FY2023, projected to hit ~20% by FY2030. Key compliance drivers include:
- Green procurement requirements from global supply chains, especially for textile and manufacturing exporters
- India's Nationally Determined Contribution (NDC) targets, which are accelerating regulatory pressure
- Customer and investor ESG reporting expectations across most large industries
Renewable procurement has become a business imperative, not just a cost decision.
You Don't Have to Choose All or Nothing
Most businesses don't need to overhaul their entire energy supply at once. A partial PPA covering a portion of grid consumption is enough to validate savings and build internal confidence before scaling.
Opten Power provides instant IRR, payback analysis, and regulatory assessment across multiple developers. Deals close up to 50% faster with automated RFPs and pre-approved contracts, replacing months of manual evaluation with a single platform view.
Real-World Transition: From Coal to Renewables
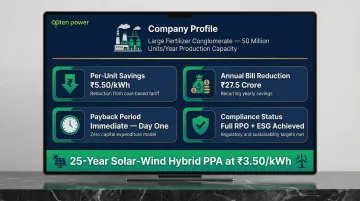
A large fertilizer conglomerate in India faced escalating grid tariffs and mounting RPO compliance pressure from state regulators. With annual consumption exceeding 50 million units and grid tariffs projected to cross ₹9/kWh, the CFO initiated a cost analysis of renewable PPAs as a long-term hedge against fuel price volatility.
The Challenge
Imported coal price swings were driving quarterly fuel surcharge adjustments that made budgeting impossible. The company also faced potential RPO non-compliance penalties approaching ₹10 lakh plus excess consumption charges, while investors and international clients increasingly demanded ESG compliance documentation.
The Decision Trigger
A detailed analysis showed that a 25-year solar-wind hybrid PPA at ₹3.50/kWh would deliver per-unit savings of ₹5.50/kWh against projected grid tariffs in year one, with savings compounding as tariffs escalated. The Corporate PPA structure eliminated upfront capital requirements, letting the company redeploy planned capex into core manufacturing expansion.
Outcome Metrics
- Per-unit cost savings: ₹5.50/kWh in year one
- Annual energy bill reduction: ₹27.5 crore on 50 million units
- Payback period: Immediate savings from day one (zero capex model)
- Compliance benefits: Full RPO compliance achieved; ESG reporting simplified
Key Takeaway
For high-consumption industrial units, every quarter spent on coal-based grid power compounds future costs — grid tariffs escalate, compliance obligations tighten, and the savings window narrows. The fertilizer company's case shows the math is already decisive at current PPA rates.
To run the same analysis for your facility, Opten Power's platform lets you compare live PPA tariffs from India's top producers across 4+ GW of capacity, with instant IRR and payback projections built in.
Conclusion
Coal-based grid power still has a role for industries in high-coal-penetration grids or in short-term transition scenarios where hybrid renewable infrastructure isn't yet deployed. But the cost math has decisively shifted in 2026. Solar and wind PPA tariffs at ₹2.68–₹3.60/kWh are 50–70% cheaper than effective coal-heavy grid tariffs of ₹7–₹10/kWh, even before accounting for hidden costs like fuel surcharges, cross-subsidy charges, and carbon compliance penalties.
The risk of inaction grows every year. Grid tariff escalation in Maharashtra alone projects a climb from ₹9.01/kWh (FY2022) to ₹10.36/kWh (FY2026). RPO targets rise annually—from 29.91% in FY2024-25 to 33.01% in FY2025-26—increasing non-compliance penalties for coal-reliant consumers. Meanwhile, renewable PPA prices remain fixed for 15–25 years, offering certainty that coal simply cannot match.
For most C&I businesses in India, the question in 2026 is not whether renewables are cheaper—they are—but how to structure the transition. That depends on factors specific to your business:
- Which ownership model fits your balance sheet — captive, group captive, or third-party PPA
- What mix of solar, wind, and storage matches your load profile
- How state-specific open access charges affect your actual landed cost
Good procurement advisory and marketplace tools exist precisely to answer these questions. Platforms like Opten Power deliver standardized landing prices across all states, instant financial analysis, and direct access to qualified developers—compressing what used to be a six-month manual RFP process into a decision you can make in days.
Frequently Asked Questions
Is renewable energy cheaper than coal power for industries in India in 2026?
Yes. Solar and wind PPA tariffs range from ₹2.68–₹3.60/kWh, compared to effective industrial grid tariffs of ₹7.15–₹10.17/kWh in most coal-heavy states. The total cost gap widens further when fuel surcharges (up to ₹2.85/kWh), cross-subsidy charges, and carbon compliance penalties are factored in.
What is LCOE and why does it matter when comparing coal and renewables?
LCOE (Levelized Cost of Energy) divides a project's total lifetime costs—capital, fuel, operations, and financing—by total energy produced, giving a true apples-to-apples comparison. In India today, utility-scale solar LCOE sits at ~₹3.1/kWh versus ~₹6.1/kWh for coal, before fuel surcharges and compliance costs push coal's figure higher still.
What are the hidden costs of coal power that businesses often overlook?
Grid tariffs are only part of coal's real cost. These add-ons inflate effective rates by 30–50% beyond the headline figure:
- Fuel surcharge adjustments: up to ₹2.85/kWh
- Transmission and cross-subsidy charges: ₹0.64–₹2.11/kWh
- Wheeling charges: ₹0.27–₹0.60/kVAh
- Carbon credit obligations under CCTS
- RPO non-compliance penalties: up to ₹10 lakh plus excess consumption charges
Can renewable energy provide reliable 24/7 power like coal for heavy industries?
Yes. Solar-wind hybrid projects with storage, combined with partial grid backup, can meet round-the-clock industrial requirements. SECI hybrid projects now achieve 50%+ capacity utilization factors with contractual obligations for peak power delivery, meeting the round-the-clock demands of steel plants, cement kilns, and data centres.
What is a Corporate PPA and how does it help businesses reduce energy costs?
A Corporate PPA is a long-term (15–25 year) fixed-price contract to buy renewable power directly from a generator at a pre-agreed tariff. It eliminates fuel price risk, provides cost certainty, and delivers savings of ₹3–5/kWh vs. grid tariffs with no upfront capital requirement for the buyer.
How long does it take to recover the investment in a renewable energy project?
For captive renewable projects (solar/wind), typical payback periods in India are 4–7 years with IRRs of 14–18%. Group captive models deliver faster payback of 1–3 years, while Corporate PPAs provide immediate per-unit savings from day one with no upfront capex required from the buyer.