
Introduction
Most businesses and households have no clear visibility into where their energy money goes. You receive a bill at month-end, but can't pinpoint which operations, appliances, or inefficiencies are driving costs up. For commercial and industrial (C&I) users, this blind spot is particularly costly — the industrial sector accounts for 49.5% of India's total energy consumption, yet metering gaps persist across facilities.
Closing that blind spot starts with calculating energy costs proactively — not just reading bills after the fact. For high-consumption C&I users, this means understanding what you're spending, where waste is occurring, and what you could save through efficiency changes, load shifts, or renewable energy procurement.
This article covers the formula to calculate energy costs, the factors that inflate bills, how to estimate real savings from efficiency changes, and how large energy consumers can compare costs against renewable alternatives.
Key Takeaways
- Energy cost = (Wattage × Hours of use ÷ 1,000) × your ₹/kWh tariff rate
- Total bill = sum of all loads + fixed charges + demand charges + taxes
- Savings = current cost baseline minus projected cost after switching or optimizing
- For C&I users, switching from grid tariffs to renewable PPAs can cut energy costs up to 40%
- A good energy savings calculator runs all these numbers across your full load profile — instantly
What Is an Energy Savings Calculator?
An energy savings calculator is a tool — digital or manual — that takes inputs like wattage, usage hours, tariff rates, and load profiles to output your current energy cost and projected savings from a specific intervention.
Who Uses an Energy Savings Calculator?
Commercial and industrial users rely on these calculators to make high-stakes decisions. Common applications include:
- Modeling savings from demand-side management or load shifting
- Comparing tariff options across state DISCOMs
- Evaluating the economics of switching to a corporate PPA
- Estimating ROI before committing to a renewable energy procurement
Cost Calculator vs. Savings Calculator
An energy cost calculator tells you what you're spending. An energy savings calculator tells you what you could save and under what conditions. For commercial buyers, that distinction drives real decisions — a baseline alone won't justify a 15-year PPA commitment, but a projected savings model with payback period and IRR analysis will.
How to Calculate Your Energy Costs: The Basic Formula
The Universal Formula
Energy Cost = (Wattage (W) ÷ 1,000) × Hours of Use × Tariff Rate (₹ per kWh)
Each variable explained:
- Wattage: Found on appliance labels or spec sheets
- Hours of use: Daily or monthly operating time
- Tariff rate: Available on your electricity bill or DISCOM website
Worked Example
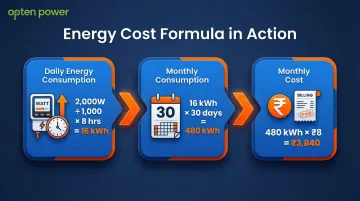
Calculate the monthly cost of running a 2,000W piece of equipment for 8 hours a day at ₹8/kWh:
- Daily energy consumption: (2,000W ÷ 1,000) × 8 hours = 16 kWh
- Monthly consumption: 16 kWh × 30 days = 480 kWh
- Monthly cost: 480 kWh × ₹8/kWh = ₹3,840
Extending to a Full Facility
A complete energy cost picture requires summing individual load calculations for every significant appliance or machine, then adding:
- Fixed charges: Meter rent, minimum guarantee charge
- Demand charges: Applicable for HT/LT commercial consumers, calculated on 15-minute or 30-minute Maximum Demand intervals
A single 15-minute demand spike can inflate your billed demand for the entire month — C&I facilities that track and control peak intervals consistently pay less.
Load Factor for Industrial Users
For factories, energy cost per unit of output is more meaningful than raw consumption.
Load Factor = Monthly Consumption (MU) ÷ Maximum Possible Consumption
Where maximum possible consumption = Contract Demand (kVA) × unity power factor × total billing hours.
A higher load factor means you're using your contracted capacity efficiently — a low load factor signals idle capacity you're still paying for.
Use the Correct Tariff Category
Residential, commercial LT, industrial HT, and open-access consumers each carry different tariff slabs and charge structures in India. For example, a textile plant on an HT industrial tariff faces demand charges that a small commercial LT consumer never sees. Using the wrong category in your calculation will significantly distort your savings estimates.
Key Factors That Influence Your Energy Bill
Appliance and Equipment Efficiency Ratings
The BEE star rating or SEER/efficiency ratio directly multiplies or divides wattage input in the formula. A 5-star rated AC draws far fewer watts for the same cooling output than a 2-star unit — a gap that adds up fast across months of runtime.
Example: Replacing 36W fluorescent tube fixtures with 15W LED fixtures cuts consumption by 58% for the same light output.
Time-of-Use and Demand Patterns
Peak-hour consumption attracts higher tariff slabs in Time-of-Day (ToD) pricing. In Maharashtra, MSEDCL offers a ₹1.50/kVAh rebate at night (22:00–06:00) but penalizes peak usage (18:00–22:00) with a ₹1.10/kVAh surcharge.
Utilities calculate demand charges based on the highest 15- or 30-minute demand recorded in a billing cycle — so a single peak spike can inflate your bill for the entire month.
Top Energy-Consuming Systems
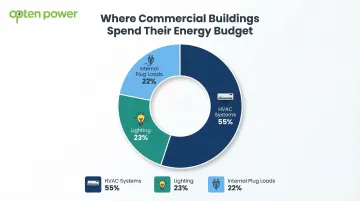
Knowing where tariffs bite hardest matters more when you map them against your biggest loads. In commercial buildings, the consumption split typically looks like this:
- HVAC systems — 55% of total electricity use
- Lighting — 23%
- Internal plug loads — 23%
In industrial facilities, motors, compressors, and process equipment dominate — making equipment efficiency ratings and demand management the two highest-leverage levers for cost control.
How to Calculate Your Potential Energy Savings
The Savings Calculation Framework
Savings = (Current Cost Baseline) − (Projected Cost After Intervention)
The baseline must be established over a representative period — typically 12 months to account for seasonal variation — before any changes are made.
Savings from an Efficiency Upgrade
Example: Replacing old lighting with LEDs
- Current consumption: 100 fluorescent tubes × 36W × 12 hours/day = 43.2 kWh/day
- LED consumption: 100 LED tubes × 15W × 12 hours/day = 18 kWh/day
- Daily savings: 43.2 − 18 = 25.2 kWh
- Annual savings at ₹8/kWh: 25.2 kWh × 365 days × ₹8 = ₹73,584
- Simple payback period: Investment ÷ Annual Savings = Payback Years
Savings from Load Shifting
If peak-hour tariffs are higher, shifting energy-intensive operations to off-peak hours reduces effective cost per kWh. A 20% consumption shift to off-peak can translate into measurable bill reduction.
Example: Shifting 200 kWh/day from peak (₹10/kWh) to off-peak (₹6/kWh) saves ₹800/day or ₹24,000/month.
Typical Savings Benchmarks
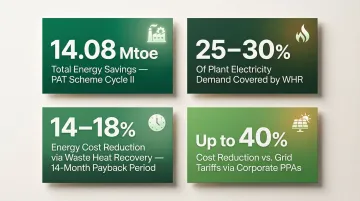
Individual calculations like the examples above align with validated sector-wide data. Across India's energy-intensive industries, benchmarks include:
- PAT Scheme Cycle II: Total savings of 14.08 Mtoe across designated sectors
- Waste Heat Recovery (WHR): Covers 25%–30% of a plant's electricity demand in heavy industries
- WHR cost savings: 14%–18% reduction in energy costs, with payback periods as low as 14 months
- Corporate PPAs: C&I buyers typically cut energy costs by up to 40% against prevailing grid tariffs
Factoring in Investment Costs for Full ROI
Simple payback works well for short-cycle upgrades like LED replacements or load-shifting measures. For longer commitments — solar installations, wind PPAs, or hybrid projects spanning 15–25 years — Internal Rate of Return (IRR) is the more relevant metric. A project clearing your organisation's hurdle rate (typically 12%–18% for Indian C&I buyers) signals a sound long-term commitment, even if the simple payback period looks longer upfront.
Energy Savings Calculations for Commercial and Industrial Businesses
Why Standard Calculators Fall Short for C&I Users
Commercial and industrial electricity bills include:
- HT tariff structures
- Contract demand
- Reactive energy (power factor penalties)
- Open-access charges
- Cross-subsidy surcharges
All of these need to be modeled to get an accurate savings estimate.
The PPA Savings Calculation
For businesses consuming large volumes of power, a Corporate Power Purchase Agreement (PPA) with a renewable developer can replace grid-purchased units at a lower per-unit cost.
PPA Savings = (Current Weighted Average Grid Tariff) − (PPA Tariff + Open Access Charges)
Open Access charges include:
- Cross Subsidy Surcharge (CSS): Varies by state (₹0.77/kWh in UP to ₹1.79/kWh in Tamil Nadu)
- Wheeling charges: State-dependent (18.27 paise/kWh in Gujarat to 96 paise/kWh in Tamil Nadu)
- Transmission charges
- Applicable taxes
How Opten Power Simplifies C&I Energy Cost Modeling
Modeling all these variables manually takes significant time — and leaves room for error. Opten Power addresses this by letting commercial and industrial businesses compare live PPA tariffs from multiple renewable developers across 16 states. Real-time DISCOM landing prices, IRR projections, payback periods, and regulatory impact are all available in one place.
The platform covers the full C&I procurement workflow:
- Compares standardized landing prices across all states with live DISCOM data
- Automates RFP creation and management through a modular tender engine
- Monitors all renewable energy investments from a single portfolio dashboard
- Delivers instant ROI comparisons and regulatory impact analysis
Portfolio-Level Visibility for Multi-Site Operators
Businesses with plants or facilities across multiple states face different tariff regimes and savings opportunities in each location. Industrial tariffs vary — for example, Maharashtra's MSEDCL charges ₹499/kVA/month demand charge versus Gujarat's Torrent Power at ₹260-335/kW/month. A unified, state-aware calculation tool matters for accurate multi-site energy cost management.
Frequently Asked Questions
How do you calculate energy cost savings?
Savings are calculated by subtracting the projected energy cost (after an efficiency change, load shift, or tariff switch) from the current cost baseline: Savings = Current Cost − New Cost, where each cost is derived from (kWh consumed × tariff rate) plus applicable fixed and demand charges.
How much is 30 kWh per day?
30 kWh/day equals approximately 900 kWh/month. At typical residential tariffs (₹6–8/kWh), this costs ₹5,400–7,200 monthly. At commercial tariffs (₹8–12/kWh), the cost ranges from ₹7,200–10,800 monthly. Check your state DISCOM tariff schedule to confirm the applicable slab for your connection category.
How much does it cost to run a 2000 watt heater for 24 hours?
2,000W ÷ 1,000 × 24 hours = 48 kWh. At commercial tariff rates of ₹7–9/kWh in India, daily cost ranges from ₹336–432. The tariff category significantly affects the result.
How many kWh does a 2000 sq ft house use per day?
An AC-equipped urban household in India's Composite climate zone consumes approximately 31–32 kWh/day; a Non-AC household in a Temperate zone consumes about 10–11 kWh/day. To find your actual figure, divide last month's billed units by the billing cycle days.
What appliances use the most electricity?
In commercial and industrial facilities, air conditioners, HVAC systems, industrial motors, and water heaters account for the largest share of consumption. These high-wattage loads running continuous hours should be the first target in any savings calculation.
What are low-cost ways for businesses to reduce energy costs?
Schedule an energy audit, benchmark consumption against current DISCOM tariff data, and shift flexible loads to off-peak hours. Operationally, setting AC thermostats to 24°C saves approximately 24% versus 20–21°C, and replacing legacy equipment with BEE 5-star-rated units cuts baseline consumption — both measures require little to no capital outlay.