Introduction
Commercial and industrial businesses across India face one recurring problem when evaluating solar through a Power Purchase Agreement: determining whether the numbers actually work for their facility.
A quoted PPA rate of ₹4.50/kWh can look attractive until you factor in cross-subsidy surcharges, wheeling charges, and additional surcharges — costs that can collectively add ₹2–3/kWh to the landed price and quietly erase projected savings.
A Solar PPA calculator bridges this gap. It translates variables — energy consumption, escalation clauses, grid tariff projections, and the full open access charge stack — into clear financial outcomes: annual savings, cumulative savings, payback period, and IRR. Before signing a 15–25 year contract, that clarity is non-negotiable.
This guide covers:
- Inputs a reliable PPA calculator requires
- Outputs it should produce
- How to interpret key financial metrics
- Factors that can skew your estimates
- How to move from a projection to a signed agreement
Key Takeaways
- Solar PPAs let businesses use solar energy with zero upfront capital—the developer owns the system and charges a fixed or escalating tariff
- Use a Solar PPA calculator to instantly estimate savings, payback period, and IRR against your current DISCOM tariff
- Key inputs: annual consumption, DISCOM tariff, PPA rate, escalation clause, contract tenure, and open access charges
- Outputs cover annual savings, cumulative savings, IRR, payback period, and carbon offset
- Accuracy depends on current state-specific DISCOM tariff data and realistic CUF assumptions
What Is a Solar PPA Calculator and Why Does It Matter for C&I Buyers?
A Solar PPA calculator is a financial modeling tool designed specifically for commercial and industrial buyers evaluating Power Purchase Agreements. It takes project-specific inputs—your facility's energy consumption, current DISCOM tariff, proposed PPA rate, contract tenure, and applicable regulatory charges—and projects whether entering a PPA will reduce your energy costs compared to buying grid power, and by how much.
Rough estimates or "average savings" figures from developers are unreliable for four specific reasons:
- Consumption profiles vary: A 24x7 manufacturing facility draws power very differently from a commercial complex operating business hours only
- State tariffs diverge sharply: Rates range from ₹5.90/kWh in Karnataka's Special Economic Zones to over ₹9.00/kWh in parts of Maharashtra
- Open access charges are routinely omitted: Cross-Subsidy Surcharge (CSS) and Additional Surcharge (ASC) can total over ₹3.00/kWh in states like Maharashtra
- Escalation rates compound over time: A 1% annual difference, sustained over a 20-year contract, shifts the total savings figure by crores
For C&I buyers, a PPA calculator is not just a budgeting tool—it is a procurement decision tool that informs whether to proceed, which developer to shortlist, and what contract terms to negotiate. With India's C&I open access solar market adding a record 7.8 GW in 2025 and landed costs increasing in 12 out of 15 major states during Q4 2025, the difference between a well-modeled PPA and a rough estimate can determine whether a deal delivers savings—or locks in a cost you didn't anticipate.
Key Inputs You Need Before Running a Solar PPA Calculation
Annual Energy Consumption
Your annual energy consumption in kWh (or units) is the baseline for sizing the solar project and estimating how much of your grid load the PPA will offset. Source this from 12 months of DISCOM bills rather than using an estimate.
Seasonal variations, production cycles, and facility expansions all affect consumption patterns. Averaged or outdated figures will skew your savings projection.
Current Grid Tariff (DISCOM Rate)
This is the benchmark against which PPA savings are measured. Tariffs vary significantly by consumer category (HT/LT), state, voltage level, and consumption slab. Using the wrong tariff figure can inflate or deflate projected savings by 20-30%. For example, Rajasthan offers voltage-based discounts from ₹7.30/kWh at 11kV down to ₹6.93/kWh at 220kV. Maharashtra and Uttar Pradesh use kVAh-based billing instead of kWh, which penalizes facilities with low power factors.
Opten Power's platform provides real-time, standardized DISCOM landing prices across 16 states, so your calculations reflect current, state-specific tariff structures rather than outdated or national average figures.
Proposed PPA Tariff and Escalation Rate
The PPA rate (₹/kWh) determines your cost under the new arrangement. The escalation clause (typically 0-5% per year) determines how costs grow over the contract period. Even a 1% difference in escalation rate materially changes 20-year cumulative savings.
Consider: a PPA starting at ₹4.00/kWh with 3% annual escalation reaches ₹7.22/kWh by Year 20. At 5% escalation, that same contract reaches ₹10.13/kWh — a 40% difference in final cost.
Contract Tenure and Capacity
Longer tenures (20-25 years) generally offer lower PPA rates but extend your commitment period. Capacity (kWp or MW) must match actual consumption needs precisely:
- Over-sizing means paying for generation you cannot use, or banking surplus energy at a cost of 7-12% of injected units
- Under-sizing means purchasing expensive grid power for the shortfall, which reduces overall savings
Open Access Charges and Regulatory Costs
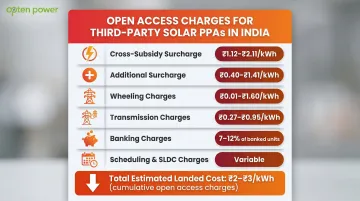
For third-party PPAs, state-specific charges are often omitted from developer proposals but can reduce net savings by 30-50%. These include:
- Cross-Subsidy Surcharge (CSS): ₹1.12-₹2.11/kWh depending on state and voltage level
- Additional Surcharge (ASC): ₹0.40-₹1.41/kWh (waived for group-captive models if fixed charges are paid)
- Wheeling Charges: ₹0.01-₹1.60/kWh depending on voltage level
- Transmission Charges: ₹0.27-₹0.95/kWh
- Banking Charges: 7-12% of energy banked (deducted as energy units)
- Scheduling and SLDC Charges: Variable by state
In Maharashtra for FY25-26, CSS and ASC alone total over ₹3.50/kWh for most HT industrial consumers. These charges have also been rising sharply: Gujarat raised its ASC by 22% between October 2025 and March 2026, and Andhra Pradesh saw a 660% increase in wheeling charges in Q2 2025. A calculator that omits them can overstate net savings by ₹1-3/kWh, turning a viable project into one that barely breaks even.
What Outputs Should a Solar PPA Calculator Produce?
Annual Energy Savings
This is the most immediate output—the difference between what you would pay under the grid tariff versus the PPA rate, adjusted for actual consumption offset. This figure changes year-on-year due to grid tariff escalation and any PPA escalation clause. For example, if your current effective DISCOM tariff is ₹7.50/kWh and your landed PPA cost (including all open access charges) is ₹6.20/kWh, your Year 1 savings on 1 million kWh consumption would be ₹13 lakh.
Cumulative Savings Over Contract Period
Total savings across the full PPA tenure (15, 20, or 25 years) justify the long-term commitment and are most meaningful for CFO-level decisions. Compounding grid tariff increases make this number significantly larger than Year 1 savings suggest. If grid tariffs escalate at 5% annually while your PPA escalates at 3%, the gap widens each year, pushing cumulative savings well beyond initial projections.
Internal Rate of Return (IRR)
For C&I buyers or investors evaluating project economics, IRR signals whether the project meets return thresholds. Current benchmarks for C&I solar projects in India range from 14–18% at the project level, according to CRISIL and ICRA assessments.
Equity IRRs for group-captive models can reach 13–17% when leveraging debt financing at 8.5–9.75% and using accelerated depreciation benefits.
Simple Payback Period
This is the point at which cumulative savings equal the cost of any upfront charges or co-investment. In a pure PPA model with zero CapEx, payback is immediate from Day 1 since there's no capital to recover. However, group-captive structures requiring 26% equity stake or hybrid models with upfront fees will have a payback period—solar projects typically achieve payback in 3–4 years.
Carbon Offset and RECs Generated
Many C&I buyers need this for ESG reporting, Scope 2 emissions targets, or Renewable Purchase Obligation (RPO) compliance. The calculator should output estimated CO₂ offset in tonnes per year based on generation assumptions.
Using the latest CEA grid emission factor of 0.710 tCO₂/MWh for FY2024-25, a 1 MW solar plant generating 1.8 million kWh annually offsets approximately 1,278 tonnes of CO₂. With national RPO targets reaching 43.33% by FY2029-30, quantifying this benefit is increasingly important.
How to Interpret Your Solar PPA Estimate: Key Financial Metrics
Savings Rate (PPA Rate vs. Grid Tariff)
This is the fundamental metric. If the landed PPA rate (including all open access charges) is lower than your effective DISCOM rate, the project delivers savings from Day 1. If they are close or inverted, the project economics are weak. A healthy gap is typically ₹1.50–₹2.50/kWh. For example, if your DISCOM tariff is ₹7.50/kWh and your landed PPA cost is ₹6.00/kWh, you have a ₹1.50/kWh savings margin—a 20% reduction in energy costs.
Escalation-Adjusted Savings Trajectory
Savings typically grow over time if grid tariffs escalate faster than the PPA escalation rate. The "crossover point"—the year when PPA costs exceed grid costs—is the key risk to identify upfront. Well-structured PPAs avoid it by keeping escalation at or below expected grid tariff growth.
Example Scenario:
- Year 1: Grid tariff ₹7.50/kWh, PPA landed cost ₹6.00/kWh = ₹1.50/kWh savings
- Year 10 (5% grid escalation, 3% PPA escalation): Grid ₹12.22/kWh, PPA ₹8.06/kWh = ₹4.16/kWh savings
- Year 20: Grid ₹19.92/kWh, PPA ₹10.83/kWh = ₹9.09/kWh savings
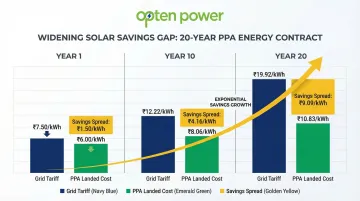
The widening margin is why 20-year contracts often outperform shorter arrangements—despite the longer commitment.
IRR vs. Cost of Capital Comparison
IRR must be compared against your internal hurdle rate or Weighted Average Cost of Capital (WACC). If your WACC is 12% and the PPA project delivers a 16% IRR, it's creating value. If IRR falls below WACC, alternative capital deployments may be more attractive.
Sensitivity to Key Assumptions
Grid tariff escalation is the single assumption that drives the long-term savings case—stress-test it first. Running scenarios at 3%, 5%, and 7% annual escalation shows the full range of outcomes:
| Grid Escalation | 20-Year Cumulative Savings (₹ Crore) |
|---|---|
| 3% (Low Case) | 2.8 |
| 5% (Base Case) | 4.5 |
| 7% (High Case) | 6.9 |
Base your commitment on the 3% scenario—any upside from steeper tariff increases becomes a bonus, not a dependency.
Factors That Can Skew Your Solar PPA Calculation
Inaccurate or Outdated DISCOM Tariff Data
Using last year's tariff order, ignoring Time of Day (TOD) surcharges, or missing Fuel and Power Purchase Cost Adjustments (FPPCA) can overstate savings by 15-25%. Tariff revisions are non-linear—they occur in "step-changes" triggered by Multi-Year Tariff orders or regulatory truing-up exercises.
Maharashtra's numbers illustrate the gap clearly: CSS rose from ₹1.69/kWh to ₹1.79/kWh and ASC from ₹1.36/kWh to ₹1.39/kWh between FY23-24 and FY24-25. Using the older figures would underestimate your landed PPA cost by ₹0.13/kWh, directly inflating projected savings.
State-specific, up-to-date tariff data is non-negotiable. Regulatory changes can shift the picture mid-contract—Karnataka halved its Additional Surcharge from ₹0.82/kWh to ₹0.40/kWh effective March 2026, a reminder that charges can fall just as sharply as they rise.
Optimistic Generation Assumptions (CUF)
Tariff data is only half the equation—generation assumptions are equally prone to distortion. Developers often use best-case Capacity Utilization Factor (CUF) figures, and an assumption that runs 5-10% high will inflate projected generation and savings proportionally. Realistic CUF ranges for solar projects in India are:
- Ground-mounted systems (high irradiation regions like Rajasthan): 21-24%
- Rooftop systems: 18-21%
- Floating solar: ~19%
- Low irradiation regions (eastern states): 19-21%

If a developer proposes a 24% CUF for a rooftop project in a moderate irradiation zone, question it. A 2% CUF overestimation on a 1 MW project means ~175,000 kWh less generation annually—translating to ₹10-12 lakh less savings per year.
Omitting Regulatory and Grid Charges
Cross-subsidy surcharge, additional surcharge, wheeling, transmission, and scheduling charges can collectively reduce net savings by 30-50%. These are state-specific and revised without notice, making them easy to overlook in a quick estimate. As of Q4 2025, net landed open access costs ranged from ₹5.00/kWh to ₹8.40/kWh across states, with the higher end driven by steep open access charges in Maharashtra, Tamil Nadu, and Karnataka.
A calculator that only compares PPA tariff to grid tariff—without factoring in the full charge stack—will produce misleading results. The complete landed cost calculation must include CSS, ASC, wheeling, transmission, banking, and scheduling charges—none of these are optional line items.
How to Move From Estimate to a Signed PPA Agreement
Validate Your Estimate with Multiple Developers
A calculator gives a directional estimate, but actual savings depend on the specific developer's offered rate, system design, and contract terms. The right next step is to issue a structured Request for Proposal (RFP) to multiple developers and compare binding offers against your calculator baseline.
Platforms like Opten Power's Automated Tender Engine streamline this step — standardized RFP templates, pre-approved contract structures, and side-by-side proposal comparison replace manual coordination and help deals close faster.
Review the PPA Contract Terms Against Calculator Assumptions
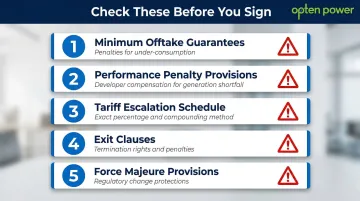
Once you have real proposals in hand, the next step is checking contract terms against what your calculator assumed. Key clauses that shift the financial outcome include:
- Minimum offtake guarantees: Penalties if you consume less than committed
- Performance penalty provisions: Developer compensation if generation falls below guaranteed levels
- Tariff escalation schedule: Confirm the exact percentage and compounding methodology
- Exit clauses: Termination rights, notice periods, and associated penalties
- Force majeure provisions: What happens if regulatory changes make the project unviable
If the contract's escalation clause is 4% but your calculator modeled 3%, re-run the numbers before signing.
Engage Regulatory and Legal Due Diligence
Especially for open access projects, state-level regulatory approvals, DISCOM consent, and net metering/banking policy compliance must be confirmed before signing. The estimate means nothing if the project isn't approvable in your state. Verify:
- Open access approval from the State Load Dispatch Centre (SLDC)
- DISCOM no-objection certificate (NOC)
- Compliance with the state's Green Energy Open Access regulations
- Banking policy terms and charges
- Wheeling agreement execution timeline
Regulatory risk is real—charges can change mid-contract. Karnataka saw a 240% increase in cross-subsidy charges in Q2 2025, while Telangana removed its additional surcharge in Q4 2025. Build contract protections for regulatory changes that materially alter project economics.
Frequently Asked Questions
What is the average PPA price for solar panels?
As of Q4 2025, C&I solar PPA tariffs in India range from ₹3.80/kWh to ₹5.20/kWh for new projects. The anticipated Domestic Content Requirement (DCR) policy is adding ~₹0.25/kWh to rates, making projects 24–38% more expensive. Rates vary by project type, location, capacity, and contract tenure.
How to calculate lease escalation?
Escalation is calculated as a fixed annual percentage increase applied to the base PPA or lease rate . For example, a ₹4.00/kWh base rate with 3% annual escalation becomes ₹4.12/kWh in Year 2, ₹4.24/kWh in Year 3, and so on. Cumulative escalation over a 20-year term can increase the effective cost significantly—₹4.00/kWh at 3% escalation reaches ₹7.22/kWh by Year 20.
How to calculate solar payoff?
Use this formula: Payback Period (years) = Total Upfront Investment ÷ Annual Savings. For zero-CapEx PPAs, there is no payback period — savings begin from Day 1. For hybrid models with a co-investment component, a ₹50 lakh investment delivering ₹15 lakh in annual savings returns payback in 3.3 years.
What is the difference between a solar PPA and a solar loan?
A PPA requires no upfront capital — you buy energy at a contracted rate while the developer owns and maintains the system. A solar loan finances full ownership, after which energy costs drop to O&M only. Owned systems offer lower lifetime costs if you have access to low-cost capital (8.5–9.75%) and can use tax benefits like accelerated depreciation; PPAs offer predictable OPEX and transfer performance risk to the developer.
How accurate are solar PPA calculators?
Accuracy depends on input quality — particularly DISCOM tariff data, CUF assumptions, and regulatory charge inclusions. Calculators using real-time, state-specific data outperform those using national averages by 20–30%; a tool that omits open access charges or applies a 24% CUF to a rooftop project will produce dangerously optimistic numbers. Always validate inputs against current tariff orders and realistic generation benchmarks.
What is a good PPA rate for solar in India?
As of Q4 2025, a strong PPA delivers ₹1.50–₹2.50/kWh in savings against your landed grid tariff. For example, a ₹6.00/kWh landed PPA cost (including CSS, ASC, wheeling, and transmission) against a ₹7.50/kWh DISCOM tariff is a solid deal. The spread between landed PPA cost and grid tariff determines deal quality — not the absolute PPA rate in isolation.