Introduction
Energy costs rank among the top three operational expenses for commercial and industrial businesses in India. For data centres, electricity bills reach approximately ₹14 crore per MW annually, while steel manufacturers like Tata Steel see fuel and power consuming 11% of total production costs. With states like Tamil Nadu hiking industrial tariffs to ₹7.5/kWh for FY26—a 3.4% increase—grid reliance is becoming a severe financial liability.
For energy-intensive industries, unmanaged procurement translates directly into margin compression and reduced competitiveness. Yet corporate renewable energy is neither inherently cheap nor expensive — its cost profile depends almost entirely on how it is procured, structured, and managed.
Poor decisions at any stage, from source selection to contract design to ongoing portfolio oversight, can erode savings that should otherwise be significant.
This article examines how renewable energy costs accumulate for businesses, what drives them, and the specific strategies that deliver real savings.
Key Takeaways
- Energy costs for C&I businesses are rising, but correctly structured renewable procurement can cut them by up to 40%
- Hidden costs—open access charges, contract mismatches, and transaction delays—erode savings as much as headline tariffs do
- The biggest savings are locked in at procurement: source selection, contract structure, and tariff benchmarking matter most
- Ongoing portfolio management prevents savings from eroding over time
- Whether renewable economics work depends on state policy, DISCOM regulations, and how well supply matches your load profile
How Corporate Renewable Energy Costs Build Up
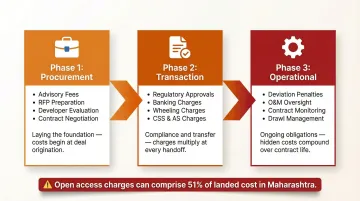
Renewable energy costs for businesses don't appear as a single line item. They accumulate across three distinct phases:
Procurement phase costs:
- Advisory and consulting fees
- RFP preparation and legal review
- Developer evaluation and due diligence
- Contract negotiation and structuring
Transaction phase costs:
- Regulatory approvals and compliance filings
- Banking charges and transaction fees
- Wheeling and transmission infrastructure charges
- Cross-subsidy surcharge (CSS) and additional surcharge (AS)
Operational phase costs:
- Deviation settlement penalties
- Operations and maintenance oversight
- Contract compliance monitoring
- Scheduled drawl management
Cost build-up is often gradual and partially hidden. Businesses focus on the headline tariff—say, ₹3.5/kWh for solar power—but overlook the landed cost after adding open access charges. In Maharashtra, for instance, open access charges comprise 51% of the total landed cost, which often erases most of the savings advantage over grid power.
These charge layers grow worse when procurement is reactive rather than planned. Short contract tenures force frequent re-procurement at potentially unfavorable rates. Delayed decisions push businesses into spot purchases during peak pricing periods.
Misaligned contract terms add another layer: minimum offtake obligations that must be paid regardless of actual consumption. Each of these is avoidable with structured procurement — and each one that goes unaddressed compounds the total cost burden.
Key Cost Drivers in Corporate Renewable Energy
Headline Tariff vs. Landed Cost
The renewable tariff is only one input into actual cost. State-specific open access charges—wheeling, transmission, banking, CSS, and additional surcharge—vary significantly and change annually. This makes the cost profile highly jurisdiction-dependent.
In Tamil Nadu, the landed cost for third-party solar open access recently increased due to the additional surcharge rising to ₹0.54/kWh. Gujarat hiked its additional surcharge by 22% to ₹1.00/kWh. Telangana's additional surcharge fluctuated from ₹1.98/kWh down to ₹0.13/kWh, then back up to ₹1.09/kWh—all within two fiscal years. These swings directly determine whether a renewable procurement stays economically viable.
Procurement Structure as Cost Determinant
Regulatory charges don't just vary by state—they also shift depending on how the procurement is structured. Choosing captive, group captive, or third-party open access changes applicable charges, tax treatment, and risk exposure. The wrong structure for a given load profile can turn a viable project into an expensive one.
| Procurement Model | Ownership Requirement | CSS & AS Liability | Capital Exposure | Best For |
|---|---|---|---|---|
| Captive | 100% owned by user | Exempt | High (full equity) | Large enterprises wanting complete control |
| Group Captive | Users hold ≥26% equity | Exempt | Medium (shared equity) | Medium-to-large industries seeking maximum ROI with minimal risk |
| Third-Party Open Access | None | Fully liable | None | Businesses with high grid tariffs (₹10-15/kWh) avoiding capital deployment |
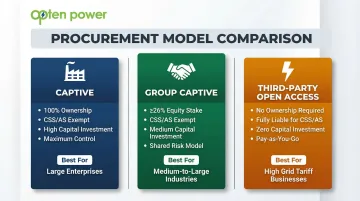
The 2023 Supreme Court ruling strictly enforces the 51% proportional consumption rule for group captive projects. Each captive user must consume electricity in proportion to their ownership share, within a 10% variation. Failing this test triggers retrospective CSS and AS levies—potentially wiping out years of accumulated savings.
Contract Terms as Compounding Drivers
Beyond structure and state charges, the contract itself compounds costs in ways that are easy to underestimate at signing:
- Tariff escalation clauses: A 3% annual escalation on a 25-year PPA adds ₹1.5–2/kWh to the effective rate by year 15
- Minimum offtake commitments: A business contracting for 10 MW but growing to only 7 MW pays for 3 MW of unused energy throughout the term
- Deviation penalties: Under CERC's 2024 DSM regulations, under-injection beyond permitted limits can attract charges up to 200% of the contract rate
- Tenure length: Longer tenures lock in today's tariff assumptions against future regulatory and market shifts
Information Asymmetry as Hidden Cost
Businesses that cannot benchmark tariffs across developers or states in real time tend to accept above-market rates without realizing it. A solar PPA at ₹4.2/kWh looks competitive in isolation, but real-time comparison across developers could reveal offers at ₹3.8/kWh for identical project specifications.
Opten Power's marketplace addresses this directly—enabling instant comparison of tariffs, savings, and IRR across developers in 16 states, so businesses enter negotiations with current market data rather than a single developer's quoted rate.
Cost-Reduction Strategies for Corporate Renewable Energy
Strategies vary depending on whether costs originate in procurement decisions, contract and asset management, or the structural context around the energy arrangement. Addressing the wrong layer produces limited results.
Strategies That Reduce Costs by Changing Decisions
The following approaches improve the quality of decisions made before signing a renewable energy contract — where the largest savings are typically locked in or lost.
Optimize energy source and technology mix
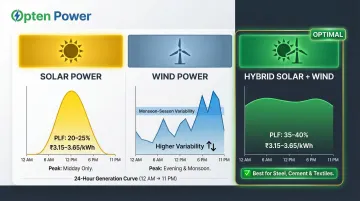
Choosing between solar, wind, or hybrid generation based on the business's load curve—rather than defaulting to the most available option—can meaningfully reduce per-unit cost and dependency on grid top-up. Solar generation peaks midday but drops off completely at night. Wind generation is stronger during monsoon months and evening hours. Hybrid projects combine both, delivering higher plant load factors (35-40% vs. 20-25% for solar alone) and more consistent generation aligned to operational hours.
For industries with 24x7 operations like steel, cement, and textiles, wind-solar hybrid PPAs reduce reliance on restrictive banking rules and minimize deviation penalties. In 2024, wind-solar hybrid auction tariffs ranged from ₹3.15/kWh to ₹3.65/kWh—competitive with standalone solar while delivering better load matching.
Benchmark tariffs across multiple developers before committing
Accepting the first offer or relying on a single developer's quote without competitive comparison is one of the most common reasons businesses overpay. A 2024 analysis found that landed costs for third-party solar open access increased in 12 out of 15 major states, driven by rising PPA tariffs and open access charges.
Real-time tariff comparison tools enable businesses to negotiate from a position of information parity. Opten Power's marketplace, for example, allows instant comparison of tariffs, savings, and IRR across developers across 16 states. This transparency prevents businesses from locking into above-market rates and creates competitive pressure among developers to offer better terms.
Select the procurement structure that minimizes regulatory charge liability
The choice between captive, group captive, and third-party open access has direct consequences on which open access charges apply and at what rate. Third-party open access is financially unviable in many states due to heavy CSS and AS. In Maharashtra, CSS for HT industrial consumers is ₹1.79/kWh, with an additional surcharge of ₹1.36/kVAh and wheeling charges of ₹0.60/kVAh—adding over ₹3/kWh to the base tariff.
Group captive structures bypass CSS and AS entirely, provided the 26% ownership and 51% consumption thresholds are met. For a business consuming 5 MW annually, avoiding ₹3/kWh in surcharges translates to ₹13 crore in annual savings. Getting the structure right at the start avoids years of unnecessary surcharge payments.
The right structure depends on load size, tenure preference, risk appetite, and state policy:
- Above 5 MW baseload, 24x7 operations: Group captive models typically deliver the highest savings
- 100 kW to 1 MW loads with high grid tariffs (₹10-15/kWh): Third-party open access may remain viable despite surcharges
- Variable or seasonal loads: Third-party open access with careful banking management warrants evaluation
Design contract terms that protect against long-run cost escalation
Fixed or capped escalation clauses, appropriate tenure length relative to the business's energy demand horizon, and clearly defined deviation settlement terms all reduce cost uncertainty over the contract lifecycle.
Consider a textile manufacturer signing a 20-year PPA at ₹4/kWh with a 4% annual escalation clause. By year 10, the tariff reaches ₹5.92/kWh. By year 20, it hits ₹8.76/kWh—potentially exceeding grid tariffs if state electricity boards moderate rate increases.
Had the manufacturer negotiated a 2% capped escalation instead, the year 20 tariff would be ₹5.94/kWh—saving ₹2.82/kWh or ₹12 crore annually for a 5 MW load.
Escalation terms rarely get renegotiated post-signing. Scrutinizing them before execution is where the leverage sits.
Strategies That Reduce Costs by Changing How Renewable Energy Is Managed
Once a contract is signed, savings can still erode through poor scheduling, missed renegotiation windows, and unchecked regulatory charge changes. Active management closes these gaps.
Monitor actual generation and consumption against contracted schedules in real time
Deviation from scheduled drawl triggers penalty payments under most open access frameworks. CERC's 2024 DSM regulations set deviation volume limits at 5% for wind and 10% for solar. Over-injection beyond these limits yields zero compensation, while under-injection attracts penalties up to 200% of the contract rate.
Businesses that monitor generation data and proactively manage scheduling reduce deviation costs significantly. Unified portfolio dashboards—like Opten Power's Portfolio Management Dashboard—give businesses a single view across all their renewable contracts, enabling faster corrective action when generation or consumption patterns shift unexpectedly.
Renegotiate or restructure contracts before they auto-renew on unfavorable terms
Many businesses lose savings at contract renewal by not actively re-tendering or benchmarking against current market rates. A PPA signed in 2019 at ₹4.5/kWh might have been competitive then, but if current market tariffs are ₹3.5/kWh, auto-renewal at the old rate costs ₹1/kWh unnecessarily.
Building a procurement calendar with proactive re-assessment triggers—ideally 12-18 months before contract expiry—is a management discipline that prevents value leakage. This allows sufficient time to run competitive tenders, negotiate better terms, or switch developers if needed.
Audit open access charges annually against applicable state regulations
Wheeling charges, banking charges, and surcharges are revised by state electricity regulatory commissions periodically—sometimes twice a year. Businesses that don't track these changes risk paying outdated or incorrect rates.
Tamil Nadu increased its additional surcharge to ₹0.54/kWh effective December 2024. Gujarat hiked its additional surcharge by 22% to ₹1.00/kWh. An annual regulatory charge audit aligned to SERC order cycles ensures charges are applied correctly and that businesses aren't overpaying due to billing errors or outdated tariff schedules.
Strategies That Reduce Costs by Changing the Context Around Renewable Energy
Beyond procurement structure and contract management, where a business sources energy from—and when—shapes the total cost as much as the tariff itself.
Choose the right state for sourcing renewable energy based on landed cost, not just tariff
Open access charge structures differ significantly across states. A lower tariff in one state may result in a higher landed cost than a slightly higher tariff in a state with more favorable wheeling and banking regulations.
| State | Sample Solar Tariff | Wheeling Charges | CSS (HT Industrial) | Additional Surcharge | Approximate Landed Cost |
|---|---|---|---|---|---|
| Maharashtra | ₹3.5/kWh | ₹0.60/kVAh | ₹1.79/kWh | ₹1.36/kVAh | ₹6.5-7.0/kWh |
| Tamil Nadu | ₹3.8/kWh | ₹1.04/kWh | ₹1.99/kWh | ₹0.54/kWh | ₹7.0-7.5/kWh |
| Gujarat | ₹3.6/kWh | ₹1.32/kWh | ₹1.36/kWh | ₹1.00/kWh | ₹6.8-7.3/kWh |
| Andhra Pradesh | ₹3.4/kWh | Variable | Determined annually | Exempt (certain sectors) | ₹4.5-5.5/kWh |
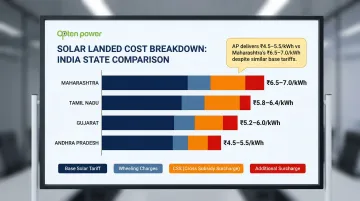
Maharashtra's ₹3.5/kWh tariff looks attractive on paper, but heavy surcharges push the landed cost to ₹6.5-7.0/kWh.
Andhra Pradesh's ₹3.4/kWh tariff, by contrast, delivers a landed cost of ₹4.5-5.5/kWh—with lower regulatory charges and exemptions available for green hydrogen, wind, and solar manufacturing sectors.
Time procurement to policy cycles and capacity availability
State-level open access policies, renewable purchase obligations, and DISCOM procurement plans create windows where pricing is more favorable. India's RPO framework mandates obligated entities to procure 43.33% of their electricity from renewable sources by 2029-30. As compliance deadlines approach, demand for renewable capacity spikes, potentially driving tariffs higher.
Businesses that procure reactively miss these windows. Procurement timing relative to policy cycles affects long-run cost. Initiating procurement 6-12 months before major RPO compliance deadlines or during periods of overcapacity allows businesses to secure better tariffs and more favorable contract terms.
Align renewable energy capacity to actual load growth trajectory
Over-contracting relative to current or near-term load creates minimum offtake obligations that must be paid regardless of consumption—essentially paying for energy not used. A business contracting for 10 MW capacity based on optimistic five-year growth projections, but only reaching 6 MW actual load, pays for 4 MW of unused energy annually.
Right-sizing procurement to realistic demand forecasts, with provisions for capacity additions through modular contracts or phased procurement, avoids this structural cost trap. Businesses should base capacity decisions on conservative load growth assumptions and build in flexibility to add capacity as demand materializes.
Conclusion
Reducing the cost of corporate renewable energy is not about switching to renewables and expecting automatic savings. It requires identifying specifically where cost originates: in procurement decisions, in contract and portfolio management, or in the surrounding regulatory and structural environment.
Businesses that achieve sustained cost reductions consistently do five things:
- Benchmark tariffs competitively across developers and states
- Select procurement structures that minimize regulatory liability
- Design contracts with protective escalation and deviation terms
- Monitor portfolios actively to prevent savings erosion over time
- Optimize state selection and load alignment to reduce cross-subsidy exposure
Cost reduction in corporate renewable energy is not a one-time transaction. Businesses that treat it that way — signing a PPA and moving on — routinely leave money on the table. Those that treat it as an ongoing discipline keep compounding the savings.
Frequently Asked Questions
Why are corporations increasing their renewable energy purchases?
Corporations are driven by rising conventional power costs, tightening ESG commitments, and the favorable economics of renewables. In India, solar and wind tariffs have declined sharply, making them cost-competitive with — or cheaper than — grid power for large consumers, often delivering 20–40% cost savings through well-structured group captive models.
How can corporations reduce the cost of renewable energy?
Corporations reduce costs through three core levers:
- Smarter procurement — source selection, competitive tariff benchmarking, and contract structure
- Active portfolio management — preventing savings erosion over the contract life
- External optimization — state selection, policy timing, and load alignment
What is a Corporate PPA and how does it reduce energy costs?
A Power Purchase Agreement (PPA) is a long-term contract between a business and a renewable energy developer for the supply of power at a fixed or pre-agreed escalating tariff. This shields the business from grid tariff volatility and typically delivers energy at below-market rates over the contract tenure.
What are open access charges and how do they affect renewable energy savings?
Open access charges — covering wheeling, transmission, banking, cross-subsidy surcharge, and additional surcharge — are levied by state regulators on energy wheeled through the grid. Added on top of the renewable tariff, they can significantly erode net savings if not factored in at the procurement stage.
How long does it take to see ROI from corporate renewable energy investments?
Payback depends on procurement structure, contract tariff, state-level charges, and your existing grid rate. For well-structured open access or captive arrangements in India, net savings typically begin in year one, with full payback on capital-linked structures within 4–7 years.
What is the difference between captive and third-party open access renewable energy?
In a captive model, the business holds at least a 26% ownership stake in the generation asset and gains exemptions or reductions on certain open access charges. Third-party open access means buying power from an independent developer with no ownership stake and lower upfront commitment. The key trade-off is regulatory charges versus capital exposure.