Introduction
Energy costs rank among the top three operational expenses for food manufacturers in India, yet most facilities still buy power the same way they did a decade ago — reactive, tariff-by-tariff, with no long-term strategy.
Industrial electricity tariffs have climbed sharply. Maharashtra now charges ₹8.36/kVAh; Tamil Nadu has reached ₹7.25/kWh for high-tension industrial consumers. For an industry running on razor-thin margins — where energy accounts for 11–27% of total operating costs depending on the sub-sector — every rupee saved on power goes directly to the bottom line.
The pressure is coming from multiple directions simultaneously:
- DISCOM tariff hikes are squeezing already-thin margins
- Renewable Purchase Obligation (RPO) targets are tightening each year
- Retail buyers and export markets are demanding demonstrable sustainability credentials
Treating energy as a fixed cost managed passively is no longer an option.
This guide breaks down the five most effective energy procurement strategies for Indian food manufacturers — from open access and PPAs to demand response — and explains how to build a roadmap that cuts costs, improves supply reliability, and aligns with sustainability goals.
Key Takeaways
- Energy accounts for 11-27% of operating costs in food manufacturing; strategic procurement can reduce this burden by up to 40%
- The five core strategies are grid tariff optimization and open access, long-term renewable PPAs, group captive models, demand-side management, and multi-source portfolio blending
- Corporate PPAs with solar or wind developers lock in costs over 10–25 years, with current tariffs ranging from ₹3.04 to ₹3.42/kWh
- Group captive structures deliver per-unit savings of ₹3–5 — legally bypassing cross-subsidy surcharges that exceed ₹3/kWh in states like Maharashtra
- Opten Power cuts procurement timelines by 50% via automated RFPs and 4+ GW of pre-vetted projects across 16 states
Why Food Manufacturing Has a Unique Energy Challenge
Food manufacturing facilities run continuous heating, refrigeration, CIP (clean-in-place) systems, air compressors, packaging lines, and cold storage — making power consumption effectively fixed without significant capital investment to change it.
Unlike discretionary manufacturing, food processing cannot curtail production during high-tariff periods. The risk is too high: spoilage, batch losses, and food safety compliance failures don't wait for off-peak hours.
The Indian context amplifies these challenges. Average industrial electricity tariffs have increased substantially over the past 3-5 years, with DISCOM cross-subsidies disproportionately affecting large commercial and industrial consumers in the food sector. Tamil Nadu's HT Industry cross-subsidy sits at 111-117% of the Average Cost of Supply, forcing food manufacturers to pay a structural premium for grid reliability.
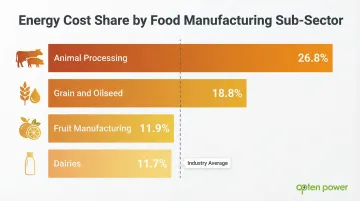
Energy intensity varies by sub-sector but remains consistently high across the board:
- Animal processing: 26.8% of operating costs
- Grain and oilseed: 18.8% of operating costs
- Fruit manufacturing: 11.9% of operating costs
- Dairies: 11.7% of operating costs
Reliability risk compounds these numbers. A single grid failure triggers production disruptions that far exceed the energy cost itself. India loses ₹4,409 crore annually due to inadequate cold chain infrastructure in the dairy sector alone — the power bill is only part of the exposure.
The Five Core Energy Procurement Strategies for Food Manufacturers
Optimize Grid Consumption and Explore Open Access
The first step for most food manufacturers is demand-side optimization — time-shifting energy-intensive processes away from peak tariff hours, correcting power factor to reduce penalties, and auditing contracted demand to eliminate unnecessary fixed charges.
Time-of-Day (ToD) pricing creates immediate arbitrage opportunities. In Maharashtra, night-time consumption (2200-0600 hrs) receives a ₹1.50/kVAh rebate, while evening peaks (1800-2200 hrs) carry a ₹1.10/kVAh penalty. Food manufacturers can achieve immediate cost reductions by shifting flexible processes — blast freezing, water pumping, heavy milling — to the 2200-0600 window.
Open Access provides the next lever for facilities consuming above 1 MW (the threshold in most Indian states). This allows food manufacturers to procure power directly from generators or traders in the open market, often at rates below DISCOM commercial tariffs. However, the net landed cost depends critically on wheeling charges, transmission fees, and cross-subsidy surcharges.
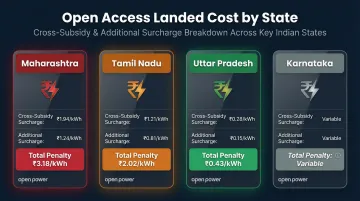
State-specific surcharge economics determine Open Access viability:
| State | Cross-Subsidy Surcharge | Additional Surcharge | Total Penalty |
|---|---|---|---|
| Maharashtra | ₹1.79/kWh | ₹1.39/kWh | ₹3.18/kWh |
| Tamil Nadu | ₹1.92/kWh | ₹0.10/kWh | ₹2.02/kWh |
| Uttar Pradesh | ₹0.43/kWh | Waived | ₹0.43/kWh |
| Karnataka | Capped at 20% of tariff | ₹0.70/kWh (RE only) | Variable |
Third-party Open Access in Maharashtra faces a combined surcharge penalty of ₹3.18/kWh, severely eroding savings. Uttar Pradesh offers a highly favorable environment with just ₹0.43/kWh CSS for HV-2 consumers, making third-party OA commercially viable there.
Long-Term Power Purchase Agreements (PPAs)
A bilateral PPA in the Indian context involves a food manufacturer signing a direct agreement with a renewable energy developer for a fixed or indexed tariff over 10–25 years. This structure insulates the company from DISCOM tariff hikes and wholesale market volatility.
This cost certainty matters most when food product pricing and export contracts span multiple years. Key commercial advantages of a well-structured PPA:
- Budget predictability: Finance teams can lock in energy costs, removing tariff-revision risk from margin calculations
- Below-market rates: Current benchmark solar PPA tariffs range from ₹3.04 to ₹3.42/kWh, well below projected DISCOM tariffs over the contract period in most states
- Built-in RPO compliance: The Ministry of Power mandates Total Renewable Energy targets of 29.91% in FY 2024-25, escalating to 33.01% in FY 2025-26 — a PPA satisfies this directly, without purchasing Renewable Energy Certificates
Group Captive and Captive Power Models
The group captive structure allows multiple non-related companies to jointly own equity in a power generation asset (typically solar or wind) and off-take power in proportion to their equity stake. This model delivers exemptions on certain open access charges and surcharges that apply to third-party sales.
Under the Electricity Rules, 2005, a power plant qualifies as captive only if at least 26% of ownership is held by the captive users, and at least 51% of aggregate electricity generated is consumed for captive use. By taking a minority equity stake in an off-site wind or solar park, food manufacturers secure zero-surcharge power — the most financially robust procurement strategy in high-surcharge states like Maharashtra and Tamil Nadu.
This model suits facilities with stable, high baseload consumption. The 26% equity minimum and 51% consumption requirement make it ideal for operations with predictable, continuous load profiles — dairy processing, cold storage, and beverage production are natural fits.
Demand-Side Management and Efficiency Investments
Reducing peak demand (kVA) cuts fixed charges and ToD penalties directly — often faster than reducing total units consumed. Specific measures include:
- Variable frequency drives on motors and compressors
- LED lighting retrofits across production and storage areas
- Waste heat recovery from refrigeration systems and boilers
- Insulation upgrades for cold storage and processing areas
A large brewery and beverage manufacturing facility in India adopted energy-saving devices including efficient boilers, better lighting, and improved electrical drives, which paid for themselves in less than one to three years. Upgrading to VFDs on refrigeration compressors and pumps yields substantial reductions in baseline energy intensity while improving process control.
Multi-Source Portfolio Blending
Sophisticated buyers don't rely on a single procurement route. They blend grid power for baseload reliability, a PPA for cost-stable renewable supply, and spot or exchange procurement for marginal top-up needs — optimizing across cost, resilience, and compliance simultaneously.
A resilient portfolio typically includes:
- Behind-the-meter rooftop solar to offset the highest marginal grid tariffs without incurring wheeling or transmission charges
- Group captive wind-solar hybrid securing 60-70% of baseload requirements through 26% equity participation, locking in tariffs around ₹3.30-₹3.50/kWh while legally bypassing CSS and AS
- Grid power for peaking and balancing primarily for reliability, actively managing consumption to maximize ToD night rebates and avoid peak penalties
Renewable Energy PPAs: The Biggest Cost-Saving Lever for Food Manufacturers
PPAs consistently deliver the deepest long-term savings for energy-intensive industries because renewable energy (solar, wind, hybrid) has seen dramatic cost declines. Utility-scale solar tariffs dropped from ₹10.95/kWh in 2010 to a record low of ₹1.99/kWh in 2020. While supply chain constraints caused slight increases post-2020, recent auctions show highly competitive pricing:
Recent PPA Tariff Benchmarks:
- SECI ISTS-Connected Solar (Tranche XV): ₹3.41–₹3.42/kWh (July 2024)
- SECI ISTS-Connected Solar (Tranche XVIII): ₹3.04–₹3.06/kWh (December 2024)
- NTPC Wind-Solar Hybrid: ₹3.35–₹3.36/kWh (March 2025)
Wind-solar hybrid projects offer a particularly attractive proposition for food manufacturers, providing a smoother generation profile that better matches 24/7 factory operations compared to standalone solar.
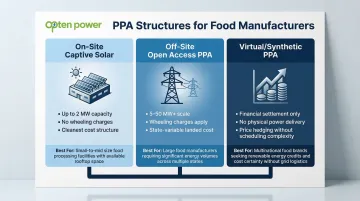
Three Main PPA Structures in India
Each structure suits different facility sizes and risk appetites:
- On-site captive solar: Panels installed on factory rooftops or adjacent land. No open access charges apply — the cleanest cost structure available. Capacity is typically capped at 500 kW to 2 MW, limited by available roof and land area.
- **Off-site open access PPA**: Sources power from remote solar or wind farms at much larger scale (5–50 MW+). Wheeling charges apply, but the scale advantage typically more than offsets the additional costs. Net landed cost varies by state regulations.
- Virtual/synthetic PPA: A financial contract with no physical power delivery. The manufacturer keeps drawing grid power and receives financial settlements based on the difference between the contracted PPA rate and a reference market price — price hedging without the scheduling complexity.
The RPO Compliance Angle
Choosing the right PPA structure also determines how you satisfy another critical obligation — RPO compliance. India's Renewable Purchase Obligation framework requires food manufacturers classified as obligated entities to procure a minimum share of consumption from renewables. A well-structured PPA simultaneously delivers cost savings and RPO compliance, eliminating the need to purchase Renewable Energy Certificates as a deadweight compliance cost.
Developer Selection and Contracting Speed
With dozens of solar, wind, and hybrid IPPs active across 16+ states, food manufacturers struggle to compare apples-to-apples on tariff, capacity, financial standing, and contract terms. Traditional PPA negotiations can take 9–18 months — a key consideration when facilities need to lock in rates before a tariff revision cycle.
Opten Power's marketplace addresses this by giving procurement teams real-time access to 4+ GW of projects across developers. Key capabilities include:
- Standardized DISCOM landing price intelligence across all states, so you see true net landed costs — not just headline tariffs
- Automated RFP tools with pre-approved contract templates
- Side-by-side developer comparison on tariff, capacity, and financial standing
Timelines that once took 9–18 months compress to weeks.
Managing Energy Price Risk with Smart Contract Design
Food manufacturers face three distinct energy price risks:
- DISCOM tariff revisions (regulatory risk): State regulators revise tariffs annually, with recent increases ranging from 5–15% across major industrial states. A PPA with a fixed tariff eliminates this exposure.
- Open access charge amendments (policy risk): Cross-subsidy surcharges and additional surcharges can change mid-contract. Change-in-law clauses shift this risk to the developer or create a shared mechanism for adjusting the contract price.
- Renewable energy developer performance risk (counterparty risk): The developer may underperform on generation commitments, face financial distress, or fail to maintain the asset properly. Minimum generation guarantees with liquidated damages protect against this risk.
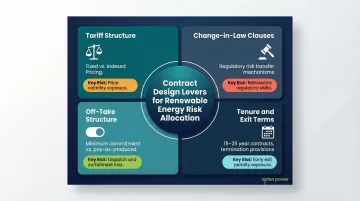
Contract Design Levers
Four levers determine how risk is allocated in any renewable energy contract:
- Tariff structure: Fixed tariffs lock in cost certainty for the full tenure, though grid tariff declines are uncommon in India. Indexed tariffs — tied to CPI or DISCOM escalation rates — share price movement risk between buyer and seller.
- Change-in-law clauses: Well-drafted provisions specify how regulatory changes (new surcharges, tax amendments, Renewable Purchase Obligation modifications) adjust the contract price, preventing surprise cost increases mid-tenure.
- Off-take structure: Minimum off-take commitments require payment for a guaranteed quantity regardless of actual consumption, shifting volume risk to the buyer. Pay-as-produced structures tie payments to actual generation, pushing performance risk back to the developer.
- Tenure and exit terms: Contracts spanning 15–25 years offer the lowest tariffs but lock in consumption assumptions. Ensure termination provisions account for facility expansions, process changes, or business restructuring.
Portfolio-Level Risk Management
Relying on a single contract or procurement route creates concentrated exposure. A practical diversification approach for food manufacturers might combine:
- A long-term open access PPA for baseload requirements (70–80% of load)
- Rooftop solar for daytime process heat and utilities
- Short-term exchange purchases to cover seasonal demand spikes
This spread ensures that a regulatory change affecting one channel — say, a cross-subsidy surcharge revision on open access — doesn't disrupt the entire supply position.
Demand Response: Turning Energy Flexibility into Revenue
Grid operators and DISCOMs increasingly need large consumers to voluntarily reduce or shift load during peak grid stress periods. In exchange, participating facilities receive financial incentives — effectively earning revenue from assets they already own.
Flexibility-Eligible Assets in Food Manufacturing
Which food manufacturing assets can participate without operational disruption?
- Refrigeration systems with thermal storage or pre-cooling buffers can curtail compressor load for 30-60 minutes without temperature excursions
- HVAC in warehousing and cold storage can pre-cool spaces before demand response events
- Air compressor staging allows sequential shutdown of compressors during peak periods
- Non-time-critical packaging lines can shift operation to off-peak hours without impacting product quality or food safety compliance
Most of these assets tolerate curtailment windows of 15 minutes to 2 hours — short enough to protect product integrity, long enough to qualify for incentive payments. That operational headroom is where the revenue opportunity sits.
Strategic Benefits Beyond Payments
Participation in demand response builds something beyond the payment itself: detailed visibility into your own load profile. That data directly improves procurement decisions across the board:
- More precise PPA sizing based on actual consumption patterns
- Better open access scheduling aligned to real peak and off-peak behavior
- Sharper ToD tariff management informed by when load can realistically shift
Building Your Energy Procurement Roadmap
Step 1: Conduct a Baseline Energy Audit
Before choosing any procurement strategy, food manufacturers need a clear picture of:
- Total consumption by process (refrigeration, thermal processing, packaging, lighting, HVAC)
- Demand peaks and load factor performance
- Power factor performance and penalty exposure
- Existing tariff structure (energy charges, demand charges, ToD differentials)
- Upcoming production expansion plans that will change load profiles
This data determines which strategies are viable and what savings potential exists.
Step 2: Define Your Procurement Objectives and Constraints
Cost reduction, supply reliability, sustainability/RPO compliance, and speed-to-savings are often in tension. A food manufacturer exporting to European retailers may weigh sustainability more heavily, while a domestic processor may prioritize pure cost reduction. Aligning leadership on the primary objective first shapes every downstream decision.
Key questions to answer:
- What is the acceptable payback period for capital investments?
- How critical is tariff certainty vs. flexibility?
- What RPO compliance obligations exist?
- Are there sustainability commitments to retail buyers or export markets?
- What is the risk tolerance for counterparty exposure?
Step 3: Model the Options Against Your Load Profile
Each procurement route has a different cost and risk profile depending on load factor, state, and consumption level. Model at minimum three scenarios:
- Continuing on DISCOM tariff with ToD optimization and power factor correction
- A PPA alone (on-site, off-site, or group captive) covering 70-100% of consumption
- A blended PPA + open access approach with grid power for balancing
Quantify the cost difference and payback period for each scenario using actual load data and state-specific tariff and surcharge structures.
Step 4: Use a Unified Platform to Execute Faster
Once the preferred strategy is identified, the biggest source of delay is sourcing qualified developers, issuing RFPs, comparing proposals, and negotiating contracts. Platforms like Opten Power shorten this cycle significantly by providing:
- Pre-vetted developers across solar, wind, and hybrid categories, with 4+ GW of available capacity ready to transact
- Automated tender creation using modular templates for structured RFP distribution and bid collection
- Real-time DISCOM intelligence with standardized landing prices across all states, so cost comparisons are accurate and current
- A portfolio dashboard that tracks all active energy assets and contracts in one place
This enables food manufacturers to close deals 50% faster compared to traditional broker-led processes.
Frequently Asked Questions
What share of total operating costs does energy typically represent for food manufacturers?
Energy cost share varies by sub-sector but typically ranges from 11–27% of operating costs. Animal processing sits at the high end (26.8%), while dairies average 11.7%. An energy audit using actual consumption data and current tariff schedules will give you a precise baseline for your facility.
What is the difference between open access power and a corporate PPA in India?
Open access allows a buyer to procure power from any generator through the grid network, paying wheeling and transmission charges plus state-specific surcharges. A PPA is a long-term bilateral contract with a specific developer for a fixed or structured tariff. The two are often combined, since many PPAs are delivered via open access infrastructure.
Can mid-sized food manufacturers with lower consumption volumes also access PPAs?
Individual PPA viability increases at higher load sizes (above 1–2 MW), but group captive structures let smaller manufacturers participate by pooling demand. Many states have also lowered the minimum open access threshold to 100 kW under Green Energy Open Access rules, widening access for mid-sized facilities.
How does RPO compliance work for food manufacturers in India?
Large industrial consumers classified as obligated entities must source a defined share of annual consumption from renewables — 29.91% in FY 2024-25, rising to 33.01% in FY 2025-26. A corporate PPA directly satisfies this requirement while cutting costs, eliminating the need to purchase Renewable Energy Certificates separately.
Which energy-intensive assets in a food plant are best suited for demand response?
Refrigeration compressors, cold storage systems, HVAC in warehousing, and air compressors are the most common flexibility-eligible assets. They can tolerate short curtailment windows (15 minutes to 2 hours) without compromising product integrity or food safety standards, especially when thermal storage or pre-cooling strategies are implemented.
How long does it take to complete an energy procurement strategy change?
A demand optimization audit can deliver results in weeks through ToD shifting and power factor correction. Full PPA or open access arrangements typically take 6–12 months end-to-end, though automated procurement platforms can cut the developer selection and contracting phases by 50%, bringing total timelines down to 3–6 months.