Data analytics is fundamentally changing how these decisions are made. Instead of relying on intuition or static assumptions, C&I buyers now use quantitative tools to benchmark tariffs against real-time market data, validate generation forecasts with probabilistic models, and monitor portfolio performance continuously. From pricing benchmarks and generation forecasting to risk scoring and compliance tracking, analytics removes guesswork and replaces it with evidence-backed decision-making.
Key Takeaways
- Analytics eliminates PPA pricing guesswork by comparing proposed tariffs against real-time DISCOM rates, competing developer quotes, and market benchmarks
- Generation forecasts rely on weather data, historical plant performance, and P50/P90 models to validate volumes before contract signing
- Risk management quantifies price, volume, profile, and counterparty risk using scenario modelling rather than static assumptions
- Automated platforms handle PPA evaluation and compliance monitoring, with a unified dashboard consolidating portfolio performance across all projects
Why Data Analytics Is Reshaping PPA Management
Renewable energy output is inherently unpredictable. Solar generation depends on cloud cover and seasonal irradiance, while wind output fluctuates with monsoon patterns. Over a 15-25 year PPA term, both generation volumes and market pricing remain uncertain—making it impossible to project savings accurately without data-driven tools. Without analytics, buyers and developers are placing long-term bets on incomplete information.
India's C&I energy market adds another layer of complexity. The country has 29 electricity regulatory commissions covering states and union territories, each governing its own set of variables:
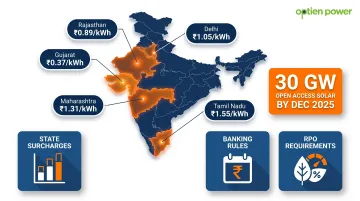
- DISCOM tariff structures and open access charges
- Wheeling, banking, and transmission rules
- Renewable Purchase Obligation (RPO) requirements
- State-level additional surcharges
Those surcharges alone ranged from ₹0.37/kWh in Gujarat to ₹1.31/kWh in Maharashtra in 2020-21, and several states tightened or withdrew banking provisions entirely during that period. India's open access solar capacity surged past 30 GW by December 2025, with 7.8 GW added in 2025 alone—tracking these shifts in real time is now a basic requirement for accurate PPA pricing.
Data analytics brings clarity to this shifting regulatory environment. Dynamic tools continuously update pricing benchmarks with live market inputs and flag when a proposed PPA term diverges from current reality. Static models built on last year's tariff data become obsolete within months—real-time analytics ensure pricing stays grounded as regulations and market conditions change.
Data-Driven PPA Pricing: How Analytics Determines the Right Strike Price
The strike price—the fixed rate per kilowatt-hour (₹/kWh) agreed today for energy delivered over the contract term—is the single most important commercial term in any PPA. Set it too high, and the buyer locks in costs above market rates for decades. Set it too low, and the developer's project becomes unviable, risking contract defaults or renegotiation disputes.
Key data inputs for Indian PPA pricing include:
- Prevailing DISCOM tariff trajectories for industrial and HT consumer categories
- Open access charges by state (wheeling, transmission, banking, cross-subsidy surcharge, additional surcharge)
- Transmission and wheeling losses
- Banking charges (where applicable)
- Taxes and duties
- Projected escalation rates over the contract term
These inputs vary significantly across India's 16+ electricity regulatory jurisdictions. For example, national HT industrial tariffs ranged from ₹2.91/kWh in Jammu & Kashmir to ₹7.75/kWh in Delhi in 2019-20, with historical YoY revision rates swinging from -0.45% to +3.19% between 2016 and 2020.
Comparative Pricing Through Analytics
Analytics platforms enable buyers to benchmark a developer's proposed tariff against real-time market rates, competing quotes, and equivalent DISCOM tariff forecasts. This reveals whether the PPA price offers genuine savings over the contract life. Opten Power's Real-Time DISCOM Intelligence provides standardized, updated landing prices across states, enabling direct like-for-like comparisons across multiple developers without manual data gathering.
IRR and Payback Analysis
Once comparative pricing is established, the next step is stress-testing financial returns across scenarios. Modelling tools compute the Internal Rate of Return (IRR) and simple payback period under different tariff escalation scenarios. For example, DISCOM tariffs rising at 3% annually versus flat PPA rates. This produces a quantified savings range rather than a single estimate, giving buyers confidence in their financial projections.
Indicative benchmarks for modelled project returns in India:
| Project Type | Project IRR | Equity IRR |
|---|---|---|
| Solar | ~7.7% | ~9.6% |
| Wind-Solar Hybrid | ~7.4% | — |
Pricing Structures and Sensitivity Analysis
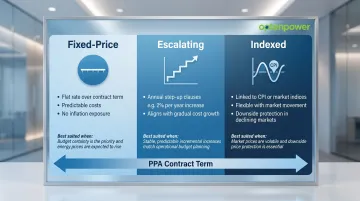
With returns modelled, the final pricing decision comes down to contract structure. PPAs come in three main forms:
- Fixed-price: Flat rate over the contract term
- Escalating: Annual step-up clauses (for example, 2% per year)
- Indexed: Linked to inflation (CPI) or market indices
Sensitivity analysis using historical tariff data helps buyers select the structure that minimizes downside risk. If DISCOM tariffs historically declined in a buyer's state, a fixed-price PPA may lock in higher costs than necessary, while an indexed structure provides downside protection.
Energy Generation Forecasting: The Foundation of a Reliable PPA
Generation forecasting is non-negotiable. A buyer's committed offtake volume must align with what the renewable asset can realistically produce. Overestimating generation means paying for energy that never materializes; underestimating it leaves savings on the table. In India, forecasting errors translate directly into grid scheduling penalties and deviation settlement charges under CERC regulations — inaccurate projections can trigger financial liabilities that erode the cost advantage a PPA is designed to deliver.
Primary data inputs for solar and wind forecasts:
- Solar irradiance data (GHI/DNI maps by state)
- Wind speed data at hub height
- Plant capacity factor benchmarks by technology and geography
- Seasonal variation profiles
- Historical P50/P90 production data from comparable assets
Understanding P50 and P90 Estimates
Two probability benchmarks anchor generation forecasts:
- P50: The median estimate — there is a 50% probability the plant will generate at least this much energy annually.
- P90: The conservative estimate — there is a 90% probability the plant will meet or exceed this output. Lenders rely on P90 for cash flow projections precisely because it accounts for underperformance risk.
Modelled Year-1 P90 PLF benchmarks in India include 18.7% for solar (Rajasthan, with 1.5 DC:AC ratio) and 34% for wind projects, according to an IEEFA renewable energy assets report.
Probabilistic Forecasting With Machine Learning
Machine learning models trained on historical weather patterns and actual plant performance produce probabilistic generation forecasts. Instead of a single annual generation number, buyers receive a range of expected output (in MUs), enabling more robust contract design.
Hybrid (solar + wind) asset forecasting is especially useful here: wind output peaks during monsoon months (June–September) while solar dips, so a blended portfolio smooths seasonal production gaps that would otherwise create shortfall risk under a fixed offtake commitment.
Generation volume forecasts answer how much energy a plant will produce. But calculating whether a PPA is financially sound over its full term also requires a view of what that energy will be worth in the market across years.
Long-term price curve forecasting addresses this gap. Financial models need projected market prices to calculate the contract's fair value at any point in time. The absence of transparent long-term electricity price curves in India makes methodology selection critical — using the wrong model can produce valuation errors that either overprice the deal for the buyer or undermine the developer's returns.
Connecting forecasts to contract terms is the final, practical step. Contracted volumes, deemed generation clauses, curtailment provisions, and performance guarantees all need calibration against forecast data.
Buyers who enter PPA negotiations with independent generation assessments are better positioned to challenge inflated Capacity Utilization Factor (CUF) claims — a common issue where developers overstate expected output to justify higher tariffs.
Using Data Analytics to Manage PPA Risks
PPAs carry four principal risk categories that data analytics can quantify:
1. Price risk: Adverse movement in market or DISCOM tariff rates that erode PPA savings 2. Volume risk: Actual generation deviating from contracted volumes due to weather or equipment issues 3. Profile risk: Mismatch between when energy is generated and when the buyer needs it 4. Counterparty risk: Developer or DISCOM failing to meet obligations
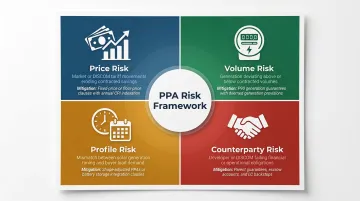
Indian C&I buyers face additional regulatory risk from policy changes in open access or DISCOM-imposed infrastructure charges. Each of these risks responds to a different analytical approach — the three most effective are outlined below.
Real-Time Data Monitoring
Continuous tracking of DISCOM tariff revisions, regulatory orders, and market price movements lets buyers assess whether the PPA continues to deliver savings. Where renegotiation clauses are built into the contract, this monitoring becomes the trigger mechanism. Tools like Opten Power's Portfolio Management Dashboard consolidate data across multiple assets and states into a single view, cutting administrative overhead and improving oversight at scale.
Scenario Modelling and Stress Testing
Running Monte Carlo simulations or sensitivity analyses across multiple variables — tariff escalation, generation shortfall, policy changes — maps the full range of financial outcomes under different conditions. Buyers set risk tolerance thresholds upfront and bring these outputs directly into contract negotiations. For example, modelling a 10% generation shortfall combined with 5% annual DISCOM tariff increases reveals whether the PPA holds up under stress.
Diversification as a Data-Informed Strategy
Portfolio analytics quantify the risk reduction benefit of combining solar and wind assets — or multiple geographies — within a single procurement strategy. Low solar generation periods often correlate with stronger wind output, so diversification stabilizes revenue and reduces exposure to single-technology weather risk. Indian hybrid tenders have required at least a 33% minority resource share to improve availability, which reflects exactly this complementarity logic.
AI and Digital Tools Transforming PPA Operations
AI and machine learning now extend beyond initial PPA pricing into ongoing operations. AI models continuously ingest weather forecasts, satellite imagery, and real-time plant sensor data to refine near-term generation predictions, flag deviations from scheduled output early, and support imbalance cost management under India's deviation settlement mechanism (DSM).
Under CERC's 2022 DSM regulations, general sellers face penalties of 120%-150% of the normal rate for larger deviations, while tolerance bands for renewables are tightening from ±10% to ±5% for solar/hybrid and ±15% to ±10% for wind from April 2026. Early deviation detection through AI reduces financial exposure to these penalties.
Predictive Maintenance Analytics
Sensors on renewable assets generate operational data that AI models analyse to predict equipment degradation before it causes generation shortfalls. According to IRENA, predictive maintenance can reduce equipment downtime by 35-45% and cut maintenance costs by 25-30%. For C&I buyers, that translates directly into fewer deemed generation disputes and more reliable contracted energy supply.
Integrated Digital PPA Platforms
Modern platforms combine RFP automation, tariff benchmarking, contract management, and portfolio monitoring in one system — compressing the time from need identification to signed contract. AI-enhanced forecasting has achieved up to 45% higher accuracy versus traditional methods, with short-term MAPE under 5% in recent deployments, and probabilistic forecasts can cut buyer reserve procurement costs by 10-25%.
These platform-level gains are reinforced at the grid level. India has deployed Regional Energy Management Centres (REMCs) with AI-based forecasting and scheduling tools that improve grid visibility and reduce curtailment risk for variable renewable energy (VRE), directly benefiting C&I buyers with open access contracts.
Frequently Asked Questions
What is PPA financing?
PPA financing uses a signed Power Purchase Agreement as a bankable revenue instrument to secure project funding. Lenders gain confidence from the guaranteed offtake at a fixed price, enabling developers to raise construction debt while buyers access renewable energy without upfront capital expenditure.
How is the PPA strike price determined?
The strike price is derived by modelling the expected generation and delivery cost for a specific renewable asset, benchmarked against prevailing market rates and the buyer's DISCOM tariff. It factors in open access charges, transmission costs, and projected tariff escalation over the contract term so both parties meet their financial objectives.
What data is most critical for accurate energy generation forecasting under a PPA?
Critical inputs include solar irradiance or wind speed data for the asset location, historical plant performance data, seasonal capacity utilization factors, P50/P90 generation probability estimates, and grid curtailment risk data specific to the state. These inputs feed probabilistic models that produce generation ranges rather than single-point estimates.
How does data analytics reduce volume risk in a PPA?
Analytics enables buyers and developers to run probabilistic generation models that reveal the realistic range of likely output volumes. This informs contracted quantity decisions, PPA structure selection (pay-as-produced vs. baseload), and the inclusion of deemed generation or performance guarantee clauses that protect both parties from unexpected shortfalls.
What is the difference between a physical PPA and a financial PPA?
In a physical PPA, the buyer receives actual electricity delivery through the grid. In a financial (virtual) PPA, no physical energy is transferred—instead, a strike price is settled financially against the market price. In India, physical PPAs under open access are the dominant model for C&I buyers, as virtual PPAs are still limited by regulatory constraints.
How can C&I buyers use analytics to verify PPA savings?
Buyers compare the projected all-in PPA landed cost (open access charges, losses, and taxes included) against current and forecast DISCOM tariffs using IRR and NPV models. Platforms with real-time DISCOM tariff data and multi-developer comparison tools make this analysis accessible without in-house modelling expertise.