Introduction
India's renewable energy sector is moving fast — and for commercial and industrial businesses, the cost of not keeping up is measurable. As of March 2026, the country achieved 274.68 GW of renewable installed capacity, ranking 3rd globally and adding a record 55.29 GW of non-fossil capacity in FY 2025-26 alone. For commercial and industrial (C&I) consumers — accounting for 40-45% of all-India energy demand — this growth creates both opportunity and complexity. Businesses face mounting pressure to cut energy costs, meet sustainability targets, and navigate regulatory environments that vary dramatically across states.
The challenge is that this scale of opportunity produces an equally large volume of data — weather patterns, grid performance metrics, tariff rates, regulatory filings — that most businesses aren't equipped to interpret. Without that capability, companies overpay on procurement, miss optimal project sites, suffer avoidable downtime, and lose visibility across multi-asset portfolios.
Data analytics bridges that gap, turning raw energy data into decisions that reduce costs and improve operational performance for C&I buyers.
Key Takeaways
- Data analytics drives smarter decisions across renewable energy — from site selection and procurement to grid integration and portfolio management
- Without analytics, businesses default to reactive maintenance, inaccurate generation forecasts, and overpayment on energy contracts
- Real-time tariff intelligence and financial modeling are among the highest-value analytics applications for C&I buyers
- AI and machine learning enable anomaly detection and faster forecasting at scale
What Is Data Analytics in Renewable Energy?
Every renewable energy decision — from signing a PPA to dispatching stored power — carries financial risk. Data analytics reduces that risk by turning raw inputs across the energy value chain into actionable intelligence.
Those inputs include solar irradiance and wind speed measurements, DISCOM tariff schedules, grid congestion data, and PPA terms. The goal is to optimize decisions at every stage: project development, procurement, operations, and financial planning.
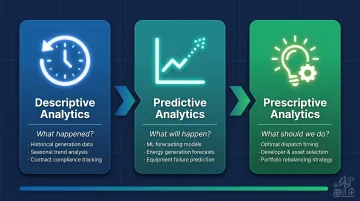
Three Core Types of Analytics
The renewable energy sector relies on three types of analytics:
Descriptive analytics answers the question: what happened? It examines historical generation and consumption patterns — past solar panel performance, seasonal output trends, contract compliance records — to establish a reliable baseline.
From that baseline, predictive analytics looks forward. Statistical models and machine learning applied to historical and real-time data can estimate tomorrow's solar generation or flag which turbine components are likely to fail within the next 90 days.
The third layer, prescriptive analytics, turns those forecasts into recommendations. When should stored energy be dispatched to maximize revenue? Which developer should you shortlist for a PPA? How do you rebalance a multi-state portfolio for maximum savings? Prescriptive models answer these questions with data, not guesswork.
Critical Data Sources
The reliability of these analytics depends on what data you feed them. Key sources include:
- IoT sensors on turbines and panels measuring performance parameters
- Smart meters tracking consumption and generation in real time
- Weather and satellite data providing solar irradiance and wind speed forecasts
- SCADA systems monitoring operational status and control signals
- Grid and DISCOM data feeds including tariff schedules, congestion pricing, and deviation settlement charges
- Financial models incorporating capital costs, operational expenses, and revenue projections
- Regulatory databases tracking state-specific charges, levies, and policy changes
Why the Renewable Energy Sector Depends on Data Analytics
The Cost of Operating Without Forecasting
Intermittent renewable sources like solar and wind generate unpredictable output. Without data-driven forecasting, utilities and C&I buyers face energy shortfalls during peak demand or expensive curtailment during surplus periods. Between May and December 2025, 2.3 TWh of solar generation was curtailed in India for grid-security reasons, resulting in estimated compensation payments of ₹5,750–6,900 million and forgoing 2.11 million tonnes of CO₂ abatement.
The primary drivers of this waste include inadequate forecasting, transmission constraints, and operational inflexibility. Analytics-driven generation forecasting allows grid operators and buyers to match supply with demand more accurately, reducing reliance on fossil fuel backup and minimizing penalty charges for deviation from scheduled injection.
The Maintenance Problem
Reactive maintenance strategies — used when organizations lack sensor data and predictive models — lead to unplanned downtime, higher repair costs, and reduced asset lifespan. Predictive maintenance programs yield estimated 12–18% cost savings compared to reactive approaches, with facilities heavily reliant on reactive maintenance recognizing savings exceeding 30–40%.
Wind turbines lose approximately 1.6% of output per year due to degradation, and in many cases, losses exceed 0.4% per year — four times the industry norm. Over 8 GW of India's solar capacity now integrates AI and IoT for predictive maintenance and fault detection, improving fault-detection efficiency by 35% and reducing maintenance downtime by 18%.
Procurement Costs Without Market Intelligence
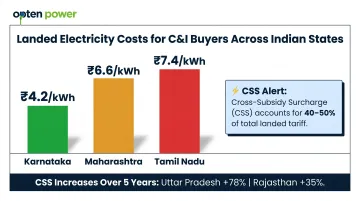
C&I businesses entering renewable energy procurement — whether through PPAs, open access, or captive projects — face a complex, opaque market. Cross-subsidy surcharge (CSS) alone accounts for 40–50% of a C&I consumer's total landed electricity tariff — and landed costs vary sharply by state:
- Karnataka: ₹4.2/kWh
- Tamil Nadu: ₹7.4/kWh
- Maharashtra: ₹6.6/kWh
Businesses without analytics-driven market intelligence lack visibility into true landed costs, regulatory levies across states, and developer pricing benchmarks. That gap is costly: CSS rose 78% in Uttar Pradesh and 35% in Rajasthan over five years, making uninformed procurement contracts a significant financial liability.
Key Applications of Data Analytics Across the Renewable Energy Value Chain
Energy Production Forecasting
Predictive analytics uses historical generation data, real-time weather feeds, and machine learning models to forecast output from solar and wind assets hours or days ahead. Accurate forecasting allows grid operators and buyers to better match supply with demand, reducing reliance on fossil fuel backup and penalty charges for deviation.
Under the CERC Deviation Settlement Mechanism (DSM) Regulations 2022, wind and solar generators face escalating penalties for forecast errors:
- Over-injection beyond 10%: Zero payment for excess energy
- Under-injection beyond 10%: Must pay back 100% of contract rate plus an additional 10% penalty
The DSM tolerance band for renewable generators is being reduced annually until 2031, making accurate forecasting increasingly critical. Industry benchmarks for wind forecasting accuracy are approximately 11% corrected normalized Mean Absolute Error (cnMAE), with machine learning techniques consistently outperforming traditional physical and statistical methods.
Predictive Maintenance
Continuous sensor data from turbines, inverters, and panels is analyzed to detect performance anomalies indicating impending failure. Irregular vibration signatures in wind turbines or declining efficiency ratios in solar panels signal maintenance needs before catastrophic failure occurs.
Shifting from reactive to proactive maintenance directly impacts economics. A 2025 study on wind turbine predictive maintenance reported zero-failure operation over simulated 19-year lifecycles, with economic performance improvements of 109.3% and 54.5% compared to benchmark maintenance strategies.
Solar panels typically degrade at approximately 0.5% per year according to NREL, retaining at least 80-85% of output at 25 years. Predictive analytics helps detect accelerated degradation early, enabling timely intervention before performance losses compound.
Renewable Energy Site Selection
Developers and investors use geospatial analytics, wind resource maps, solar irradiance data, and transmission infrastructure data to identify sites with the highest energy yield potential and lowest grid interconnection risk. NIWE's assessment indicates India's gross wind power potential of 302.25 GW at 100 meters above ground level, with high-potential regions spanning Andhra Pradesh, Gujarat, Karnataka, Maharashtra, and Tamil Nadu.
India receives annual average Global Horizontal Irradiance (GHI) of approximately 4-7 kWh per square meter per day across most regions, with peak values in Rajasthan, Gujarat, and parts of central and southern India. Analytics layers in land use restrictions, environmental assessments, and proximity to load centers to shortlist commercially viable locations faster — cutting months off early-stage project development.
Grid Integration and Stability Management
Analytics tools help grid operators manage the variable nature of renewables through real-time monitoring of frequency, voltage, and power quality. In 2025, India added 38 GW of new solar capacity, which outpaced the system's flexibility improvements, leading to emergency curtailment of 2.3 TWh of solar generation.
Smart grids and automated demand response — both enabled by analytics — balance supply and demand dynamically, preventing blackouts and integrating distributed energy resources at scale. India is undertaking the world's largest smart metering rollout under the Revamped Distribution Sector Scheme (RDSS), targeting 250 million smart meters, with 52.8 million installed as of December 2025.
Digital optimization through AI and IoT is projected to reduce transmission losses by 9-12% in India's renewable energy sector. The normal grid frequency band is 49.97-50.03 Hz; deviations outside this band trigger settlement charges, making real-time monitoring essential for cost control.
Financial Modeling and Investment Analysis
Analytics platforms model financial outcomes for renewable projects by pulling together key variables to generate IRR, NPV, and payback period estimates:
- Capital expenditure and operational cost projections
- Forecasted generation based on resource data
- Offtake pricing under PPA or open-access structures
- Applicable regulatory incentives and depreciation benefits
For C&I buyers, this analysis determines whether a captive or open-access project beats grid tariffs — and by how much.
Solar tariffs in India fell from approximately ₹10/kWh in 2014 to ₹2.5/kWh in 2024 — a 75% reduction in a single decade. C&I rooftop solar systems in continuous-load industries typically achieve payback periods of 3-5 years, falling to under 2 years with accelerated depreciation benefits.
India's renewable energy transition requires annual investments exceeding USD 25-30 billion to achieve the 2030 target. Financial analytics enable investors and buyers to deploy capital efficiently by modeling risk-adjusted returns and comparing investment options.
How Analytics Transforms Renewable Energy Procurement for C&I Businesses
For C&I buyers in steel, cement, manufacturing, IT parks, data centers, and other high-consumption sectors, analytics is essential not just for managing assets, but for making smart procurement decisions. Selecting the right PPA structure, developer, tariff option, and state for sourcing power requires data-driven intelligence. Without it, buyers are left comparing options manually — exposed to mispricing and regulatory blind spots.
Real-Time Tariff and Pricing Intelligence
Analytics platforms aggregate and standardize DISCOM tariff data, open access charges, transmission losses, and regulatory levies across multiple states to provide a true "landed cost" of renewable energy from different sources and locations. This eliminates the manual effort of comparing multi-state tariff orders and enables instant, like-for-like comparisons.
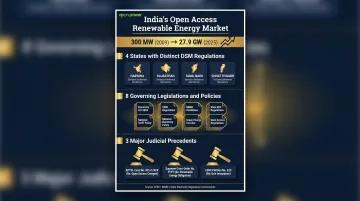
India's open access renewable energy market grew from approximately 300 MW in 2009 to 27.9 GW by September 2025, with renewables expected to account for nearly 35% of the energy mix by 2030. Regulatory complexity remains a real barrier to procurement decisions. The landscape includes:
- 4 states with distinct Forecasting, Scheduling, and DSM regulations (Haryana, Rajasthan, Tamil Nadu, Chhattisgarh)
- 8 specific legislations/policies governing open access markets
- 3 major judicial precedents shaping how charges are applied
Opten Power's Real-Time DISCOM Intelligence provides standardized, updated landing prices across all states — giving C&I buyers a clear view of true costs without the manual research burden. Buyers can compare sourcing options across states in real time and pinpoint the most cost-effective strategy.
IRR, Payback, and Regulatory Analysis
Procurement analytics tools model the financial return of a proposed PPA or captive project — factoring in tariff rates, contract tenure, escalation clauses, applicable incentives, and regulatory fees — to give buyers an IRR and payback period in seconds rather than weeks of manual analysis.
Under the 2022 Green Open Access Rules, the eligibility threshold was reduced from 1 MW to 100 kW, and nodal agencies must approve open access applications within a mandatory 15-day window. Only 6 types of open access charges are permitted (Transmission, Wheeling, CSS, Additional Surcharge, Standby, Banking), and CSS cannot increase by more than 50% over a 12-year period from commissioning.
Analytics platforms incorporate these regulatory parameters directly into financial models. Opten Power delivers IRR, payback, and regulatory analysis in seconds, letting buyers evaluate and compare multiple projects without commissioning weeks of external analysis.
Developer and Project Benchmarking
Analytics enables buyers to compare competing bids from multiple renewable energy developers side by side — across factors like tariff, technology mix (solar/wind/hybrid), project readiness, credit profile, and contract terms. This shifts the power dynamic in procurement, giving buyers objective data to negotiate better terms.
The top 5 states (Karnataka, Tamil Nadu, Maharashtra, Gujarat, Andhra Pradesh) contribute 83% of India's total renewable energy open access capacity. By benchmarking developer offers across these markets, buyers can identify outliers and secure competitive pricing.
Opten Power's platform lets buyers compare tariffs, savings, and ROI across multiple developers in real time, with access to 4+ GW of renewable projects spanning solar, wind, and hybrid technologies.
Portfolio Performance Monitoring
Businesses managing multiple renewable energy assets or PPAs across states need a unified analytics dashboard to monitor energy generation, consumption, cost savings, deviation losses, and contract compliance in real time. Fragmented data across states makes it nearly impossible to catch underperformance early or rebalance contracts before costs compound.
Opten Power's Portfolio Management Dashboard consolidates all renewable energy investments into a single view — tracking generation performance, identifying underperforming assets, and surfacing rebalancing opportunities before they become costly. For multi-state portfolios, this unified visibility is the difference between proactive strategy and reactive damage control.
AI and Machine Learning: Taking Renewable Energy Analytics to the Next Level
Traditional analytics relied on rules-based models and historical averages. AI and machine learning have changed that — enabling dynamic models that continuously learn from new data rather than applying fixed thresholds.
ML models trained on thousands of turbine or panel performance profiles detect subtle degradation patterns that rule-based systems miss entirely, improving the accuracy of generation forecasts, anomaly detection, and demand predictions over time.
Specific AI Applications in Renewable Energy
Neural networks drive short-term wind and solar forecasting by identifying non-linear relationships between weather inputs and generation output. Research published in Energy Reports (2024) confirms that ML techniques — including SVMs, RNNs, and ensemble methods — consistently outperform traditional physical and statistical forecasting methods for variable renewables.
For contract and compliance workflows, natural language processing (NLP) extracts key terms from regulatory filings, PPA contracts, and tender documents. Platforms like ContractPower apply NLP to automate contract intelligence for renewable energy asset managers, developers, and advisors — cutting document review time from days to minutes.
Reinforcement learning tackles dispatch optimization: real-time algorithms determine when to draw from or curtail renewable generation to maximize output value, managing the variability that makes solar and wind challenging to integrate at scale.
AI in Procurement and Marketplace Intelligence
AI is reshaping how renewable energy deals get done. Key applications include:
- Automated RFP engines that generate and distribute procurement requests without manual drafting
- AI-driven bid evaluation that scores developer proposals against standardized criteria
- Real-time pricing optimization that surfaces the best available tariffs across active capacity
Together, these tools eliminate manual bottlenecks, reducing deal closure times and improving outcomes for both buyers and developers.

Guidehouse (April 2026) notes that AI-enabled dynamic planning helps utilities respond to load growth, distributed energy resource (DER) adoption, and resilience risks in real time. India's renewable sector adds urgency to this shift — solar capacity has grown at a CAGR of approximately 24.8% and wind at 10.3% between 2010 and 2025. At that pace, managing distributed energy systems without AI-driven planning is simply not viable.
Frequently Asked Questions
What is data analytics in renewable energy?
Data analytics in renewable energy involves collecting and interpreting data from energy systems, weather sources, grid infrastructure, and financial models to optimize generation, procurement, maintenance, and investment decisions.
What are the main types of data analytics used in renewable energy?
The three core types are descriptive analytics (analyzing past generation and consumption patterns), predictive analytics (forecasting future output, demand, or equipment health), and prescriptive analytics (recommending optimal operational or procurement actions based on data).
What does an energy data analyst do in renewable energy?
An energy data analyst collects and processes data from sensors, smart meters, DISCOM feeds, and financial systems. They build forecasting models, identify inefficiencies, and translate findings into actionable insights for operations, procurement, and investment teams.
How does data analytics help reduce renewable energy costs?
Analytics targets costs at each stage of energy operations. Predictive maintenance cuts unplanned downtime, real-time tariff intelligence prevents procurement overpayment, and generation forecasting reduces deviation penalties and backup power costs.
What is the role of AI and machine learning in renewable energy analytics?
AI and ML improve the accuracy and speed of energy analytics by learning from historical patterns, detecting anomalies in real time, optimizing energy storage dispatch, and automating procurement processes like RFP evaluation and financial modeling.
How can businesses use data analytics for renewable energy procurement decisions?
Analytics platforms give C&I buyers real-time visibility into landed tariff costs across states, instant IRR and payback modeling for proposed PPAs, developer benchmarking tools, and portfolio dashboards. This enables faster, more informed procurement decisions without relying on manual analysis or consultant reports.