Introduction
Energy costs are now one of the most volatile operational expenses for commercial and industrial businesses across India. Power and fuel costs account for 26-28% of total expenses for Indian cement firms, with CRISIL projecting a 10-12% year-on-year increase. Industrial users also face a 10-25% markup over the cost of supply due to cross-subsidy mechanisms, which directly erodes competitiveness.
Layer on top of that: fluctuating DISCOM tariffs, evolving open access regulations across 16 states, and a fast-expanding renewable energy market. Energy procurement has become one of the most complex cost management decisions industrial businesses face.
Power procurement analytics gets discussed often, but its actual value only surfaces when energy managers can act on real data — not supplier estimates or outdated spreadsheets. The gap between reactive procurement and data-driven strategy widens over time, especially for businesses operating across multiple states or evaluating long-term renewable transitions.
This article breaks down what procurement analytics software actually does in practice — and how it translates into measurable cost savings, faster decisions, and lower procurement risk.
Key Takeaways
- Power procurement analytics software collects and analyzes energy pricing, tariff, and contract data to support better buying decisions
- Core advantages include real-time tariff intelligence, predictive financial modeling (IRR, payback), and unified portfolio visibility
- Without it, businesses routinely overpay, miss savings windows, and manage energy contracts reactively
- Best suited for high-consumption industries managing multi-state Indian operations or weighing renewable transitions
- Consistent use compounds savings over time; treat it as an ongoing strategy, not a one-time audit
What Is Power Procurement Analytics Software?
Power procurement analytics software is a specialized decision-support tool that aggregates and analyzes energy pricing, tariff, regulatory, and contract data — giving businesses a structured way to evaluate power sourcing options and manage their energy portfolio.
It's used primarily by energy managers, procurement heads, and CFOs across commercial and industrial facilities. Common users include:
- Steel plants and process industries comparing open access costs against DISCOM tariffs
- Data centers and IT parks evaluating long-term Corporate PPA structures
- Manufacturing units and commercial complexes modeling savings across multiple developer proposals
For these users, the software's purpose goes beyond reporting. It closes knowledge gaps between buyers and suppliers, replaces manual spreadsheet analysis with instant scenario modeling, and flags regulatory risks before they translate into penalties — ultimately driving faster deal decisions and lower energy costs.
Key Advantages of Power Procurement Analytics Software
These advantages matter most to organizations consuming large volumes of power across multiple states — where cost variation, regulatory complexity, and contract volume make manual tracking genuinely costly.
Real-Time Tariff and Cost Intelligence
This advantage gives energy teams a live, standardized view of what power actually costs across DISCOMs, states, and procurement routes (grid, open access, PPA), so comparisons are made on verified data rather than outdated estimates.
How it works:
The platform continuously pulls and normalizes DISCOM landing prices, open access charges, wheeling and banking fees, and cross-subsidy surcharges across all relevant states into one interface — eliminating manual research across disconnected sources.
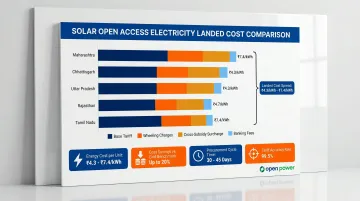
In Q3 2024, landed costs for third-party solar open access ranged between ₹4.3/kWh and ₹7.4/kWh across 15 states. That gap reflects real state-by-state variation: in Maharashtra, open access charges comprised 51% of landed cost; in Chhattisgarh, just 27.4%.
Why it matters:
Without real-time pricing intelligence, businesses either overpay for lack of benchmarks or stall decisions waiting for supplier quotes. Real-time data closes this gap and enables immediate cost comparison. When Uttar Pradesh increased wheeling charges by 14.8% and cross-subsidy surcharge by 58.1%, buyers using analytics software could instantly recalculate landed costs and adjust procurement strategies — those relying on quarterly reviews were caught off guard.
This translates directly to negotiation leverage: when an energy manager knows the true landing price before entering an RFP, they can identify overpriced offers immediately and negotiate from knowledge rather than speculation.
KPIs impacted:
- Energy cost per unit (₹/kWh)
- Cost savings vs. grid benchmark
- Procurement cycle time (days from evaluation to decision)
- Tariff accuracy rate
Highest impact when: evaluating open access options across multiple states, during frequent DISCOM tariff revision cycles, or negotiating long-term PPAs where even small per-unit gaps compound significantly over a 10–25 year contract.
Predictive Financial Modeling for Procurement Decisions
This advantage allows energy teams to run IRR, payback period, NPV, and scenario analysis on competing power sources — solar, wind, hybrid, open access, or grid — in seconds, without relying on external consultants or manual spreadsheets for every evaluation.
How it works:
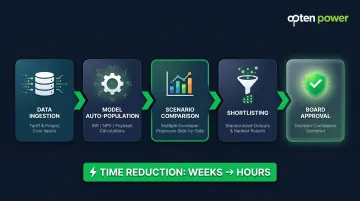
The system embeds financial models that auto-populate with current tariff data, project costs, regulatory charges, and incentive structures, generating standardized outputs that allow like-for-like comparison across developer proposals. For context, corporate clean energy contracts in India typically take 3–9 months to negotiate before build periods begin — and much of that time is consumed by financial evaluation and approval cycles.
Why it matters:
Manual financial modeling introduces inconsistency — different analysts apply different assumptions, making comparisons unreliable. Software-driven modeling eliminates this variation and provides a standardized, repeatable basis for board approval.
When procurement teams can evaluate more options and shortlist faster, decision quality improves. India's renewable project WACC expanded by ~320 bps during 2020–2024 due to global monetary tightening, with debt pricing for solar/wind projects ranging from 8.5–9.75% in 2025. Analytics platforms account for these shifts automatically; manual models often don't.
KPIs impacted:
- IRR accuracy
- Decision-to-contract cycle time
- Number of scenarios evaluated per RFP
- Cost savings identified per evaluation cycle
Highest impact when: evaluating Corporate PPAs with 15–25 year terms, hybrid procurement structures, or comparing multiple developer proposals simultaneously. The longer the contract horizon, the more a precise financial model compounds in value.
Unified Portfolio Visibility and Regulatory Risk Management
For businesses with energy procurement spread across multiple contracts, states, or generation sources, this advantage provides a single view of the entire power portfolio — including contract status, compliance milestones, capacity utilization, and cost performance — rather than managing each piece in isolation.
How it works:
The platform consolidates all active contracts, capacity allocations, and regulatory obligations (open access approvals, banking schedules, RPO compliance) into one dashboard that surfaces alerts, contract renewal windows, and performance gaps automatically. Opten Power's Portfolio Management Dashboard delivers this unified visibility across 16 states, enabling energy managers to monitor all renewable energy investments, active contracts, and energy assets from a single interface.
Why it matters:
Fragmented portfolio management leads to missed contract renewal windows, non-compliance penalties, and untapped capacity — invisible costs that quietly erode energy savings.
The scale of risk is concrete: over 35 GW of renewable energy capacity is at risk of grid curtailment in fiscal 2027 due to slower transmission build-out, with projects holding Temporary GNA facing ~80% of total curtailment. A 50% average curtailment over 12 months can reduce equity IRR by up to 150 bps — a risk that early intervention through unified visibility can prevent.
A unified view prevents reactive firefighting by surfacing risks before they become losses. Visibility enables proactive intervention, which is consistently cheaper than corrective action.
KPIs impacted:
- Portfolio cost per unit (₹/kWh)
- Contract compliance rate
- Open access utilization rate
- Renewable energy contribution as % of total consumption
- Penalty avoidance (₹)
Highest impact when: operating across 3+ states, managing a mix of PPA, open access, and captive generation sources, or scaling a renewable energy portfolio over time. As India added 6.9 GW of solar open access capacity in 2024 — up 77% year-over-year — the number of contracts and compliance touchpoints for active buyers has grown sharply.
What Happens When Power Procurement Analytics Is Missing or Ignored
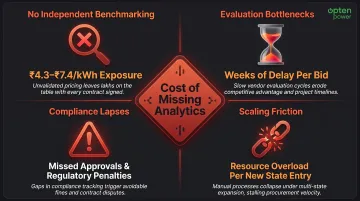
Without analytics infrastructure, energy teams face compounding operational costs — not from a single failure, but from four distinct gaps that compound each other.
- No independent benchmarking: Landed costs vary from ₹4.3 to ₹7.4 per unit across states for identical procurement models. Accepting the first supplier proposal without verification locks businesses into consistent overpayment on tariff and PPA deals.
- Evaluation bottlenecks: Manual processes delay decisions by weeks, causing businesses to miss favorable tariff windows or lose preferred capacity allocations to faster-moving competitors. 80%+ of Indian industrial respondents report high digital readiness on energy efficiency, yet skill shortages and legacy system integration continue to widen the gap between intent and execution.
- Compliance lapses: Fragmented contract management leads to missed open access approvals and penalties that eat into negotiated savings. DISCOMs are reluctant to adhere to the 15-day GEOA approval timeline mandated by regulation — and without unified tracking, approvals slip through the cracks.
- Scaling friction: Adding a new state, a new asset class (wind, hybrid), or a new developer to the evaluation mix becomes disproportionately resource-intensive without a standardized framework.
This last point matters more each year. Cumulative solar open access reached 20.2 GW with a 25.7 GW pipeline as of March 2025. Procurement teams operating without analytics are already struggling to keep pace — and the market isn't slowing down.
How to Get the Most Value from Power Procurement Analytics Software
Analytics tools deliver compounding value only when woven into the procurement workflow as standard practice — not pulled out once before signing a contract, but used as the operating layer for every energy evaluation.
Operational conditions where value is maximized:
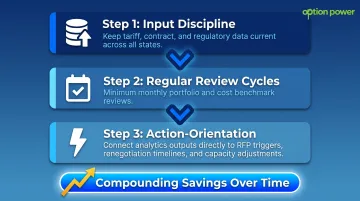
Input Discipline
The software is only as accurate as the data fed into it. Teams must ensure DISCOM tariff updates, contract amendments, and regulatory changes are reflected promptly. Platforms like Opten Power that standardize this data collection across 16 states reduce this burden, but buyers should still validate data accuracy periodically.
Regular Review Cycles
Portfolio performance, cost benchmarks, and contract KPIs should be reviewed at defined intervals, not just at renewal time, so emerging risks are caught early. State-specific changes like UP's 58.1% increase in cross-subsidy surcharge can appear with minimal notice: monthly reviews are the practical minimum, making quarterly-only cycles a liability.
Action-Orientation
Frequent reviews only matter if they trigger decisions. Documented insights that sit unused generate no value. The goal is to connect analytics output directly to procurement actions: RFP triggers, renegotiation timelines, capacity adjustments.
Heavy industry electricity demand is projected to grow from 175 TWh (2022) to 253 TWh by 2030 — a 45% increase that will only accelerate the pace of procurement decisions. Analytics must drive action, not just awareness.
Conclusion
Power procurement analytics software delivers value across three dimensions that reinforce each other: real-time cost visibility, financially precise scenario modeling, and full portfolio oversight. The more complex your energy consumption and contracts become, the more each of these capabilities earns its keep.
The organizations that embed analytics into their day-to-day procurement rhythm — not just at deal time — consistently outperform those relying on periodic reviews and manual analysis. In India's power market, where landed costs vary significantly across states, tariffs shift quarterly, and regulatory frameworks keep changing, that operational discipline is what separates proactive buyers from reactive ones.
Frequently Asked Questions
What is data analytics in procurement?
Data analytics in procurement uses software to collect, process, and interpret purchasing and supplier data — identifying cost savings, managing risk, and improving sourcing decisions. In power procurement, this means analyzing tariff data, energy costs, contract performance, and regulatory compliance to enable smarter energy sourcing.
How is procurement analytics used to improve decision making?
Analytics replaces estimates and manual comparisons with verified, real-time data. Energy managers can evaluate multiple power sources on standardized financial metrics, identify overpriced offers instantly, and make faster, more defensible procurement choices backed by quantitative analysis.
What is the 80/20 rule in procurement?
The 80/20 (Pareto) rule in procurement suggests that roughly 80% of a business's cost exposure typically comes from 20% of its contracts or spend categories. In power procurement, this means focusing analytics effort on the largest energy contracts and highest-cost tariff categories first yields the greatest savings impact.
What metrics does power procurement analytics software typically track?
Key metrics include energy cost per unit (₹/kWh), IRR and payback period for PPA decisions, DISCOM tariff benchmarks by state, open access utilization rate, contract compliance status, and renewable energy contribution as a percentage of total consumption — alongside landed cost components like wheeling charges and cross-subsidy surcharges.
How does power procurement analytics software help with Corporate PPA decisions?
It enables businesses to compare developer proposals on standardized financial models (IRR, NPV, payback), cross-check offered tariffs against real-time DISCOM benchmarks, and run scenario analysis across contract structures. Evaluation time drops from weeks to hours, improving both decision confidence and negotiation leverage.
Do businesses need separate analytics tools for each state's power regulations?
No. A unified platform standardizes multi-state regulatory data — open access charges, banking rules, and DISCOM tariffs — into one interface. State-by-state manual tracking becomes unmanageable beyond 2-3 states, making a purpose-built platform essential as portfolio complexity grows.