Introduction
India's renewable energy sector reached a record $68 billion in investment in 2025, driven by an ambitious national target of 500 GW of non-fossil capacity by 2030. Yet behind these compelling returns lies a sobering reality: over 50 GW of auctioned capacity remains stranded due to transmission delays and unsigned Power Sale Agreements, while DISCOMs owe generators ₹672.91 billion in unpaid dues as of December 2024.
The core problem facing investors and C&I buyers isn't access to opportunities — it's managing the compounding risks that characterise renewable energy investments: financial counterparty exposure, regulatory volatility across states, operational underperformance, and climate-driven resource variability.
Most entrants focus exclusively on IRR and payback periods while underestimating these factors. Without robust systems to detect them early, projects stall, miss projected returns, or fail entirely.
This guide covers the full risk landscape — from contract structuring and portfolio diversification to financial instruments and digital tools — so you can move from reactive firefighting to proactive risk prevention.
Key Takeaways
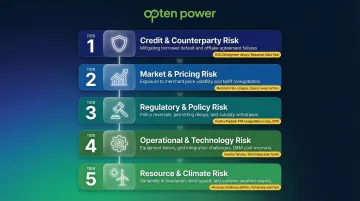
- Renewable energy investments face five major risk categories: credit/counterparty, market/pricing, regulatory/policy, operational/technology, and resource/climate
- Mitigation combines due diligence, PPA safeguards, portfolio diversification across states and technologies, and regulatory monitoring
- Financial instruments (PPAs, insurance, partial guarantees, weather derivatives) shift specific risks to parties better equipped to bear them
- Over 40 GW of SECI-awarded capacity remains stuck with unsigned PSAs due to poor risk detection, demonstrating how delayed identification erodes investor confidence and project IRR
- Digital platforms deliver real-time portfolio monitoring, automated risk alerts, and centralised DISCOM intelligence in place of error-prone spreadsheets
The Renewable Energy Investment Risk Landscape
Renewable energy investments carry a fundamentally different risk profile than conventional power. Unlike thermal plants with predictable fuel costs and dispatchable generation (on-demand output), RE projects combine long asset lifetimes with weather-dependent revenues and shifting policy environments.
The core risk drivers include:
- High upfront capital requirements with 20–25 year payback horizons
- Revenue dependence on solar irradiance and wind resource variability
- Technology degradation that compounds over decades
- Regulatory frameworks varying across India's 16+ active RE procurement states
Credit and Counterparty Risk
RE projects involve multiple parties—offtakers (utilities or C&I buyers), EPC contractors, equipment suppliers, and lenders—each introducing the risk that financial distress on their end disrupts project cash flows. In emerging markets, offtaker default and utility non-payment have consistently ranked among the top barriers to RE project financing.
DISCOM Financial Health
In India, DISCOM creditworthiness directly determines PPA viability. Key risk indicators include:
- Outstanding dues: DISCOMs owed generators ₹672.91 billion as of December 2024
- AT&C losses: Aggregate Technical and Commercial losses reached 15.04% in FY 2024-25
- Payment delays: States like Andhra Pradesh saw receivable periods stretch to 18–19 months due to tariff renegotiation disputes and partial payments
For C&I buyers and developers relying on long-term PPA revenue streams, delayed DISCOM payments force reliance on working capital loans, directly eroding project returns.
Market and Pricing Risk
Energy price fluctuations create revenue uncertainty, particularly for projects locked into long-term PPAs at fixed tariffs. Two primary exposures exist:
Merchant Risk vs. Contracted Risk
- Merchant projects without long-term contracts face spot price volatility
- Contracted projects risk locking in tariffs below future market rates
- Competitive tariff discovery through auctions reduces this risk by establishing market-clearing prices
Recent tariff benchmarks:
| Technology | Lowest Tariff | Year |
|---|---|---|
| Solar (RUMSL Neemuch) | ₹2.15/kWh | 2024 |
| Solar (SECI Tranche XVI) | ₹2.48/kWh | 2024 |
| Wind (SECI Tranche XIX) | ₹3.67/kWh | 2026 |
| Hybrid with storage (Peak Supply) | ₹4.64/kWh | 2023 |
Currency and Macroeconomic Risk
For projects importing equipment or servicing foreign debt, exchange rate volatility materially increases lifecycle costs. The rupee depreciated to ₹84.96/USD in late 2024. At the same time, domestic module prices remained 137% higher than global rates due to the ALMM mandate — a double pressure on developer margins.
Regulatory and Policy Risk
Changing feed-in tariffs, shifting Renewable Purchase Obligation (RPO) norms, state-level policy variability, and evolving environmental clearance requirements create uncertainty for long-duration investments. The World Economic Forum's 2024 Global Risks Report identifies policy instability as a top-five risk in emerging markets — and for RE investors, it translates directly into stranded capital.
Political risk in India:
State-level interventions frequently disrupt project economics:
| State | Policy Change | Impact |
|---|---|---|
| Andhra Pradesh | Retroactive tariff renegotiation (2019) | Attempted reduction to ₹2.43/kWh; quashed by High Court in 2022 |
| Gujarat | Banking charges for open access | Proposed ₹1.5/kWh charge retained until June 2026 |
| Karnataka | Green energy open access rules | High Court struck down rules limiting banking to one month |
| Rajasthan | Transmission delays | 60 GW stalled awaiting CTUIL connectivity approvals |

Land acquisition disputes, interstate transmission access hurdles, and wheeling/banking policy changes across states add layers of unpredictability that vary significantly by location.
Operational, Technology, and Resource Risk
Operational and Technology Risk
Equipment failure, EPC contractor underperformance, and O&M gaps all threaten generation profiles. Lenders scrutinize technology track records closely for three reasons:
- Degradation rates vary: NREL data shows median PV degradation of 0.88%/year in hot climates vs. 0.48%/year in cooler regions
- Warranty gaps for newer module types create financial exposure
- Lenders require proven technology track records to approve financing
Resource Risk
Solar irradiance variability, wind resource underperformance vs. P50/P90 estimates, and extreme weather events increasingly impact asset performance. A CRISIL analysis of 12.5 GW solar and 8 GW wind assets found over 60% of wind projects underperformed P90 estimates over five years, primarily due to lower-than-anticipated wind speeds — while 77% of solar assets met or exceeded P90 levels.
This performance variability extends beyond annual averages. Physical events can wipe out generation entirely: Cyclone Amphan in 2020 caused economic losses exceeding $13 billion, exposing both the physical damage risk and the insurance availability constraints that follow major weather events.
Why Unmanaged Risk Can Derail RE Investments
Late or inaccurate risk detection produces three compounding consequences: higher risk exposure, uninformed reactive decisions, and weakened portfolio outcomes.
Financial consequences of poor risk assessment:
Over 40 GW of utility-scale RE capacity awarded by SECI remains stuck with unsigned PSAs as of early 2025. DISCOMs delay signing in anticipation of falling tariffs, trapping developer capital. Between 2020 and 2024, 38.3 GW of capacity was cancelled—19% of total issued capacity—due to undersubscription and PSA delays.
Investors who can't flag problems early face:
- Cost overruns and delayed financial close
- Forced asset write-downs eroding equity returns
- Invalidated business cases for C&I buyers locked into 15–25 year energy savings models
The domino effect on project finance:
When risk isn't proactively managed, lender confidence erodes, refinancing becomes harder, and equity IRR degrades. The Weighted Average Cost of Capital (WACC) for Indian RE projects expanded by 320 basis points through 2024. A 400 bps increase could restrict India's 2030 RE capacity to 400 GW—100 GW short of target.
Why spreadsheet-based risk management fails:
Spreadsheet-based systems create siloed data and manual updates that prevent teams from connecting warning signs across multiple projects. Risk assessors operate with incomplete information, missing early signals that could prevent revenue loss. Centralised, digitised platforms address this directly—enabling real-time monitoring across an entire portfolio before problems compound.
Key Risk Mitigation Strategies for Renewable Energy Investors
Rigorous Due Diligence and Developer Screening
Comprehensive pre-investment due diligence covers:
- Technology track record and manufacturer degradation warranties
- Developer financial health and EPC contractor performance history
- Site-specific resource data (P50/P90 analysis with independent validation)
- Module/inverter warranty terms and manufacturer creditworthiness
Investors who skip or rush this step expose themselves to operational underperformance. Lenders typically mandate independent technical and legal review—equity investors should treat this as non-negotiable even for smaller deals. Standardised data templates make this process faster and more comparable across developers.
PPA Structuring and Contractual Safeguards
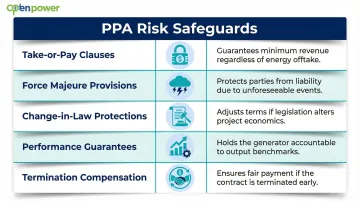
A well-structured Power Purchase Agreement is the single most powerful risk management tool. Critical terms include:
- Take-or-pay clauses – lock in revenue certainty regardless of offtaker consumption
- Force majeure provisions – protect against uncontrollable events
- Change-in-law protections – provide restitution when regulations shift post-signing
- Performance guarantees – hold developers accountable to generation estimates
- Termination compensation – define exit terms that protect both parties
Match PPA tenor to debt repayment schedules. Long-term contracts without adequate price review mechanisms expose parties to input cost volatility—especially in India, where module prices, DISCOM tariffs, and wheeling charges can shift significantly across a 15-year horizon.
Portfolio Diversification and Geographic Spread
Portfolio diversification across technologies (solar, wind, hybrid), geographies (states), and offtaker types (utilities vs. C&I) reduces concentration risk. A single-state, single-technology portfolio remains especially vulnerable to localised policy changes or resource underperformance.
Platforms like Opten Power, which list 4+ GW of capacity across 16 states, make it practical to compare developer terms across regions in real time—reducing both pricing risk and geographic concentration in a single workflow.
Regulatory Monitoring and Compliance Safeguards
Regulatory tracking cannot be a one-time exercise. RPO compliance, wheeling and banking rules, transmission access policies, and net metering frameworks all evolve at the state level—and any of these can materially affect project economics after signing. Proactive monitoring prevents compliance penalties and revenue disruptions.
Recommended actions:
- Build regulatory change clauses into project agreements
- Maintain a state-by-state regulatory risk register
- Track DISCOM payment track records and tariff changes
- Monitor transmission availability and banking policy shifts
For multi-state C&I portfolios, a dedicated regulatory register by state—updated quarterly—is the most reliable way to stay ahead of rule changes before they affect contracted returns.
Financial Instruments for Risk Transfer in Renewable Energy
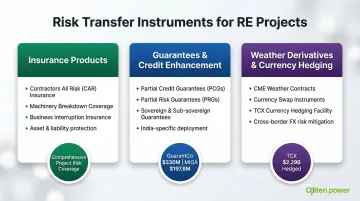
Not all risks can be fully mitigated through better contracts or due diligence—some must be transferred to parties better equipped to bear them. The spectrum ranges from insurance to guarantees to derivatives.
Insurance Products for RE Projects
Key insurance categories include:
- Construction All Risks (CAR) – covers physical damage during construction
- Machinery Breakdown – protects operational equipment (turbines, inverters)
- Business Interruption – compensates for revenue loss during downtime
- Delay in Start-Up – protects anticipated revenues if project completion is delayed due to covered physical damage
Coverage terms vary significantly by technology type (offshore wind vs. solar PV vs. biomass). A coverage gap still exists for many RE-specific risks: most policies are adapted from conventional energy products and carry exclusions for technology risk, resource variability, and exploration risk for newer technologies. During project finance structuring, investors should map coverage exclusions against the project's specific risk profile—particularly for newer or hybrid technologies where off-the-shelf policies often fall short.
Guarantees and Credit Enhancement Instruments
Partial credit guarantees (PCGs) and partial risk guarantees (PRGs) from multilateral development banks—World Bank Group, ADB, AfDB—backstop lenders against specific events: government default, regulatory breach, and non-payment. These instruments directly cut the cost of capital for RE projects in emerging markets.
India-specific applications:
| Instrument | Application | Impact |
|---|---|---|
| GuarantCo guarantees | Green bonds (Vivriti Capital, KPI Green Energy, Muthoot Capital) | Mobilised ~$330M in 2025; elevated bond ratings to AA+(CE) |
| MIGA guarantee (World Bank) | $197.6M guarantee to Citi for SBI loan | Supported 1,004 MW of C&I rooftop solar |
Sovereign and state government guarantees on PPA obligations from DISCOMs serve similar functions—improving lender confidence, enabling longer loan tenors, and reducing equity IRR hurdle rates. These instruments become more constrained when sovereign debt levels are high.
Weather Derivatives and Currency Hedging
Weather derivatives are financial contracts allowing RE project owners to hedge against revenue loss from resource variability (wind underperformance, low irradiance periods) by linking payouts to weather indices. CME Group reported a 260% surge in weather derivative trading volumes, reflecting increased use by energy participants. Sparse weather data infrastructure restricts access in many markets, though satellite monitoring improvements are steadily expanding coverage.
Where weather derivatives manage resource risk, currency hedging instruments (forwards, swaps) address a separate exposure: hard currency financing and imported equipment costs. For most Indian C&I RE investments, this risk is managed by denominating PPAs in INR and sourcing domestic debt where possible. Specialised facilities like TCX and GuarantCo provide emerging market currency risk coverage—TCX hedged $2.29 billion across 43 currencies in 2023.
Using Data and Technology for Proactive Portfolio Risk Management
The shift from analogue to digital risk management is fundamental. Spreadsheet-based systems create data silos, slow down risk assessors, and increase the probability of missing early warning signals. digitised, centralised portfolio systems give risk managers real-time access to project performance, counterparty health, and regulatory changes across their entire portfolio.
Purpose-built platforms enable:
- Risk threshold configuration with automatic alerts when metrics approach limits
- Standardised risk reports generated in seconds rather than hours
- Reduced time from risk identification to corrective action
- Cross-portfolio signal synthesis that reveals emerging patterns
Traditional O&M approaches leave more than 70% of collected operational data unused due to SCADA system silos. The lack of advanced analytics leads to delayed fault detection and suboptimal operations.
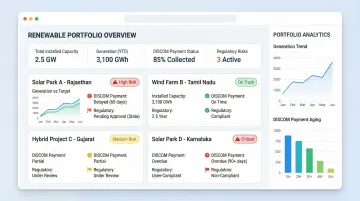
Opten Power's Portfolio Management Dashboard provides complete visibility over energy portfolio performance, enabling investors and C&I buyers to monitor renewable energy investments from a single unified dashboard. This includes real-time DISCOM intelligence across all states—payment track records, standardised landing prices, and regulatory changes—information that itself functions as a form of procurement risk management.
Without this visibility, buyers risk overpaying or committing to counterparties with weak payment track records — both of which compound in value destruction over a long-term PPA.
The data advantage extends beyond procurement. AI-driven platforms using digital twins and predictive maintenance algorithms have achieved 30–40% reductions in soiling losses. Advanced asset performance management (APM) tools go further, detecting subtle anomalies — such as overheating gearboxes — before SCADA alarms trigger, preventing days of unplanned downtime.
Frequently Asked Questions
What are the key risk mitigation strategies for renewable energy investments?
Effective risk mitigation combines rigorous due diligence on technology, developer financials, and site resource data with well-structured PPAs that include take-or-pay and change-in-law protections. Portfolio diversification across technologies and geographies, continuous regulatory monitoring, and financial instruments like insurance and guarantees round out a complete risk management framework.
How can I mitigate financial risk in renewable energy investment projects?
Financial risk mitigation starts with structuring PPAs to secure stable revenue streams, followed by credit enhancement instruments (guarantees, letters of credit) to protect against counterparty default. Maintain adequate project reserves and use insurance products to cover physical damage and business interruption scenarios that could disrupt cash flows.
What are the main types of risk in renewable energy investment?
Renewable energy investments face five distinct risk categories, each requiring its own mitigation approach:
- Credit/counterparty risk — offtaker payment default
- Market and pricing risk — tariff volatility and currency exposure
- Regulatory and policy risk — changing RPO norms and state-level policy shifts
- Operational and technology risk — equipment failure and degradation
- Resource/climate risk — irradiance variability and extreme weather events
How does counterparty or offtaker risk affect renewable energy projects?
Offtaker risk—the risk that the electricity buyer (utility or C&I customer) fails to make PPA payments—directly threatens cash flows and debt service. In India this is particularly relevant given DISCOM financial health variability across states. It's managed through sovereign guarantees, letters of credit, and liquidity facilities that backstop payment obligations.
What role do Power Purchase Agreements (PPAs) play in managing RE investment risk?
PPAs are the primary contractual risk management tool. They lock in revenue certainty via take-or-pay clauses, shield both parties from regulatory changes through change-in-law provisions, and define clear performance and termination terms. A well-structured PPA protects buyer and seller across the full contract duration—typically 15–25 years.
How does regulatory risk impact renewable energy investments in India?
India's state-by-state variation in RPO norms, wheeling and banking policies, and DISCOM tariff structures can shift project economics after signing. Investors manage this through change-in-law clauses, real-time policy monitoring, and geographic diversification across multiple states to limit exposure to any single jurisdiction.