Introduction: Why Indian Businesses Are Asking "When Will Solar Pay Back?"
Commercial and industrial electricity tariffs in India have climbed steadily over the past decade, making solar one of the most financially compelling investments for C&I buyers. According to the Central Electricity Authority's 2023 tariff compendium, High Tension (HT) industrial tariffs range from ₹3.88/kWh in Goa to ₹28.74/kWh during peak hours in Tamil Nadu — extreme state-to-state volatility driven by cross-subsidization policies that directly shapes solar ROI.
That volatility is precisely why payback modeling is so difficult. Generic calculators miss the variables that matter most in India: state-specific tariff structures, DISCOM net metering caps, 40% Accelerated Depreciation benefits, and Time-of-Day surcharges. The result is unreliable projections that stall otherwise sound investment decisions.
TLDR:
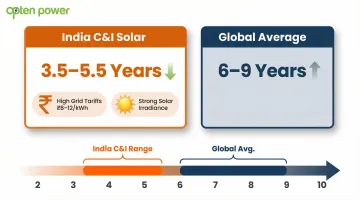
- Indian C&I solar payback periods cluster between 3.5–5.5 years, far shorter than global averages
- 40% Accelerated Depreciation creates massive Year 1 tax shields that reduce effective system cost
- State tariffs vary widely — Maharashtra and Tamil Nadu offer fastest payback due to high grid rates
- Accurate payback models require tariff escalation, panel degradation, and O&M cost inputs
- Platforms like Opten Power enable side-by-side CAPEX vs. PPA comparisons with instant IRR analysis
What Is the Solar Payback Period (and How Is It Different from ROI)?
The solar payback period measures how many years it takes for cumulative energy savings to equal the net upfront installation cost. It's distinct from Return on Investment (ROI), which calculates total profit over the system's 25-year lifespan as a percentage of invested capital.
Why CFOs Prioritize Payback Period
Payback period directly influences three core financial decisions:
- Capital budgeting cycles — determines which projects make it into the annual plan
- Loan tenure decisions — aligns debt repayment with energy savings timelines
- Internal hurdle rates — most C&I companies require payback within 5-7 years for project approval
CFOs and procurement heads use this metric as a go/no-go filter before any solar project moves forward.
Indian C&I Solar: Faster Payback Than Global Averages
For Indian C&I buyers, payback periods currently range from 3.5 to 5.5 years, well below international benchmarks. This advantage stems from two factors: high commercial grid tariffs (often ₹8-12/kWh) and strong solar irradiance across most industrial regions. Even when project costs temporarily rise, payback extends by only 6-12 months, keeping the investment highly attractive.
Step-by-Step: How to Calculate Solar Payback Period for Commercial Solar in India
Step 1 — Net System Cost
Calculate net capital expenditure by subtracting all applicable incentives from total installed cost.
Formula:
Net System Cost = Total Installed Cost - Accelerated Depreciation Tax Benefit - State Subsidies - GST Input Tax Credit
40% Accelerated Depreciation Calculation: Under Section 32 of the Income Tax Act, solar power generating systems qualify for 40% AD in Year 1. For companies under the Section 115BAA tax regime (22% base rate plus surcharge and cess), the effective tax rate is approximately 25.17%.
Example:
- Total installed cost: ₹3,00,00,000 (₹50,000/kW for 600 kW system)
- AD benefit: ₹3,00,00,000 × 40% × 25.17% = ₹30,20,400
- GST input credit: ₹3,00,00,000 × 12% = ₹36,00,000 (if applicable)
- Net System Cost: ₹2,33,79,600
Step 2 — Annual Energy Generation
Formula:
Annual Generation (kWh) = System Size (kW) × Peak Sun Hours × 365 × Performance Ratio
Worked Example — Rajasthan vs. West Bengal:
Rajasthan (500 kW system in Jaisalmer):
- GHI: 2,056.8 kWh/m²/year
- Performance Ratio: 0.80
- Specific Yield: 1,819.9 kWh/kWp/year
- Annual Generation: 500 kW × 1,819.9 = 9,09,950 kWh
West Bengal (500 kW system in Kolkata):
- GHI: 1,682.9 kWh/m²/year
- Performance Ratio: 0.80
- Specific Yield: 1,424.6 kWh/kWp/year
- Annual Generation: 500 kW × 1,424.6 = 7,12,300 kWh
The Rajasthan system generates 27% more power annually than the West Bengal system despite identical capacity.
Step 3 — Annual Savings Calculation
Formula:
Annual Savings = Units Generated × Avoided Grid Tariff (₹/kWh)
Time-of-Day (ToD) Tariff Considerations: Many states now impose ToD surcharges that directly affect your savings calculation:
- Tamil Nadu adds 25% during peak hours (06:00–10:00 & 18:00–22:00)
- Maharashtra charges ₹0.80/kWh extra from 09:00–12:00 and ₹1.10/kWh from 18:00–22:00
Solar generation during morning peak hours captures these premium rates, delivering greater savings than a flat-tariff calculation would suggest.
Net Metering Credits: Some states allow net metering, where surplus energy is credited against grid bills. However, many states cap net metering at 500 kW or 1 MW for industrial consumers. Rajasthan recently increased its cap from 500 kW to 1 MW, while other states enforce stricter limits that affect savings calculations.
Example (Maharashtra manufacturing plant):
- Annual generation: 9,09,950 kWh
- Average avoided tariff: ₹9.50/kWh (including ToD benefits)
- Annual Savings: ₹86,44,525
Step 4 — Simple Payback Period Formula
Formula:
Payback Period (Years) = Net System Cost ÷ Annual Savings
Worked Example:
- Net System Cost: ₹2,33,79,600
- Annual Savings: ₹86,44,525
- Simple Payback Period: 2.7 years
This figure is a starting point. Step 5 shows how tariff escalation and panel degradation shift the actual payback date — sometimes by a full year or more.
Step 5 — Advanced Payback (Accounting for Escalation and Degradation)
A more accurate model factors in:
- Grid tariff escalation: Historically 5-6% annually in India
- Panel degradation: Approximately 0.5% per year
Impact of Tariff Escalation: If grid tariffs increase 5% annually, your savings grow each year:
- Year 1: ₹86,44,525
- Year 2: ₹90,76,751
- Year 3: ₹95,30,589
A system with a 4.5-year simple payback may reach actual payback in 3.8 years once escalation is applied — a 0.7-year difference that compounds further over a 25-year asset life.
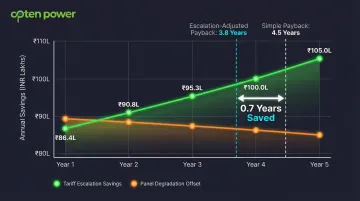
Panel Degradation Impact: With 0.5% annual degradation, Year 10 generation will be approximately 95% of Year 1 output. Over the first 5–7 years, this adds roughly 0.1–0.2 years to payback — a minor offset against the gains from tariff escalation.
Key Factors That Affect Solar Payback Period in India
State Electricity Tariff
Commercial and industrial tariffs vary dramatically across states. Businesses in Maharashtra or Tamil Nadu paying ₹9-10/kWh see much faster payback than those in low-tariff states.
Representative Commercial Tariff Comparison:
| State | HT Industrial Tariff | Payback Impact |
|---|---|---|
| Maharashtra | ₹8.12-₹8.36/kVAh + ToD surcharges | Fastest payback (3.5-4.5 years) |
| Tamil Nadu | ₹6.90/kWh base + 25% peak surcharge | Fast payback (4-5 years) |
| Karnataka | ₹7.40/kWh + ₹1.00/kWh evening peak | Fast payback (4-5 years) |
| Rajasthan | ₹6.50-₹7.50/kWh | Moderate payback (4.5-5.5 years) |
| Uttar Pradesh | ₹6.10-₹7.10/kVAh + 15% summer peak | Moderate payback (5-6 years) |
Solar Irradiance and Location
Global Horizontal Irradiance (GHI) varies widely across India. The solar belt (Rajasthan, Gujarat, Madhya Pradesh) generates more annual units per kW than northeastern or coastal states.
Why the Same ₹1 Crore System Has Different Payback: A 200 kW system in Jodhpur (GHI: 2,020.9 kWh/m²/year) generates 3,60,060 kWh annually. The same system in Kolkata (GHI: 1,682.9 kWh/m²/year) produces only 2,84,920 kWh — a 26% gap that impacts payback timelines.
System Type and Financing Structure
Rooftop vs. Ground-Mounted:
- Rooftop on-grid: Shortest payback (3.5-5 years) due to lower land costs and direct consumption
- Ground-mounted: Slightly longer payback (4-6 years) but suitable for larger capacities
Financing Impact:
- Equity-funded (CAPEX) carries higher upfront cost but delivers full ownership and depreciation benefits
- Debt-financed structures lower your equity outlay, though annual debt service reduces net savings
- "Equity payback" — time to recover your equity investment — differs from total investment payback and is often the more relevant metric for C&I buyers
Accelerated Depreciation and Tax Benefits
The 40% AD benefit reduces the effective system cost and is one of the most impactful levers for C&I buyers.
Tax Benefit Calculation:
Tax Benefit = System Cost × 40% (AD Rate) × Effective Tax Rate (25.17%)
For a ₹3 crore system:
- AD benefit: ₹3,00,00,000 × 40% × 25.17% = ₹30,20,400
- This reduces effective Year 1 cost by over ₹30 lakh
- Shortens payback by 0.3-0.5 years depending on annual savings
O&M Costs and Panel Degradation
Annual O&M Costs: Typically 0.5-1% of system cost for C&I installations. For a ₹3 crore system, budget ₹1.5-3 lakh annually for cleaning, monitoring, inverter maintenance, and insurance.
Panel Degradation: Solar panels degrade at a median rate of 0.5% per year. Premium manufacturers offer better warranties:
- Trina Solar: 0.4% annual degradation for N-type modules
- LONGi: 0.35% degradation with 88.85% power retention after 30 years
Net Impact: Subtract annual O&M from gross savings and account for gradual generation decline. A system generating ₹86 lakh savings in Year 1 with ₹2 lakh O&M costs yields ₹84 lakh net savings, lengthening payback slightly.
Captive Solar vs. Corporate PPA: Which Has a Faster Payback?
Two Primary Procurement Models
1. Captive/CAPEX Model: The business owns and pays upfront for the solar asset. Typical payback: 4-7 years with significant capital requirement.
2. Corporate PPA/OPEX Model: A third-party developer owns the asset and sells power at a fixed tariff below grid rates. Zero upfront capital required.
Payback Dynamics Comparison
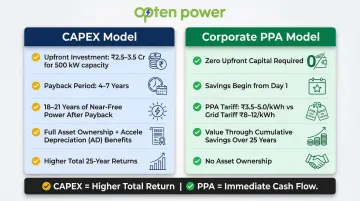
CAPEX Model:
- Requires ₹2.5-3.5 crore upfront for a 500 kW system
- Payback in 4-7 years
- After payback, enjoy 18-21 years of near-free power
- Full control over asset and depreciation benefits
PPA Model:
- No traditional "payback period" since you don't own the asset
- Savings begin from Day 1 — you pay the PPA tariff (typically ₹3.5-5.0/kWh) instead of grid rates (₹8-12/kWh)
- Immediate positive cash flow
- Value measured through cumulative savings over 25-year contract term
CAPEX delivers higher total returns over 25 years; PPA wins on immediate cash flow without capital deployment. The right choice depends on your liquidity position and risk appetite — which is why running both models side by side matters. Opten Power lets C&I buyers compare real-time IRR, payback timelines, and regulatory costs across multiple CAPEX and PPA options from verified developers, rather than relying on projections from a single source.
Realistic Payback Period Benchmarks for C&I Solar in India
Benchmark Table by Industry Segment
| Industry Segment | System Size | State | Grid Tariff | Estimated Payback |
|---|---|---|---|---|
| Manufacturing Plant (1 MW rooftop) | 1,000 kW | Maharashtra | ₹9.50/kWh | 3.5–4.5 years |
| Warehouse (500 kW rooftop PPA) | 500 kW | Tamil Nadu | ₹8.75/kWh | 4–5 years |
| IT Park (2 MW ground-mounted captive) | 2,000 kW | Karnataka | ₹8.40/kWh | 4.5–5.5 years |
| Hospital (200 kW rooftop) | 200 kW | Rajasthan | ₹7.50/kWh | 5–6 years |
| Data Centre (5 MW hybrid) | 5,000 kW | Gujarat | ₹8.00/kWh | 4–6 years |
What "Good" Looks Like
For Indian C&I solar, a payback period of 4–6 years — against a 25-year asset life — typically delivers an IRR of 15–20%, which is strong by any infrastructure benchmark. Anything above 7–8 years should prompt re-examination of:
- Tariff assumptions
- Incentive eligibility
- Alternative financing (PPA instead of CAPEX)
- System sizing or technology choices
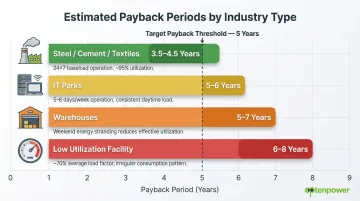
How Industry Type Shifts Your Payback Timeline
These benchmarks don't apply uniformly — your operating pattern is one of the biggest variables.
Industries like steel, cement, and textiles running 24×7 generate maximum annual savings. A cement plant with 80% baseload can absorb nearly all solar output during daylight hours, hitting a 4-year payback even in moderate-tariff states.
IT parks and warehouses operating 5–6 days a week face a different problem: "weekend stranding," where solar generation exceeds on-site consumption. Without favorable net metering or banking provisions, these facilities typically size systems conservatively — pushing payback toward 5–7 years.
Capacity utilization compounds this further. A facility running at 70% load will take 30–40% longer to achieve payback than one at 95%, since lower consumption reduces grid offset.
How to Reduce the Solar Payback Period for Your Business
Maximize Financial Incentives
Claim All Available Benefits:
- Ensure 40% AD is claimed in Year 1
- Check state-level solar policies — some states offer additional CAPEX subsidies for MSMEs
- Explore priority sector lending for lower interest rates
- Investigate green bonds or concessional financing that reduce debt costs
Several states offer additional incentives beyond central government benefits. Review your state's renewable energy policy for capital subsidies, wheeling charge exemptions, or banking provisions.
Optimize System Design for Maximum Yield
Work with installers to match system capacity to actual consumption patterns. Oversizing leads to export losses in states with poor net metering; undersizing reduces total savings potential.
Premium modules with 21–22% efficiency generate more power per square foot of roof space — useful for space-constrained facilities where every kW counts.
In Maharashtra, for instance, businesses face ₹1.10/kWh evening peak charges under ToD tariffs. Adding battery storage shifts solar generation to those peak hours, making hybrid configurations economically sound for high-consumption facilities.
Use Competitive Procurement to Lower Installed Cost
Design optimizations improve yield — but competitive procurement directly reduces your installed cost. Getting multiple developer quotes through structured RFPs can cut system cost by 10–15%, shortening payback without changing a single panel.
Example Impact:
- Original quote: ₹52,000/kW for 500 kW = ₹2.6 crore
- Competitive bid: ₹47,000/kW for 500 kW = ₹2.35 crore
- Savings: ₹25 lakh (reduces payback by ~0.3 years)
Opten Power's automated RFP engine lets businesses solicit and compare developer bids across 4+ GW of capacity in 16 states — closing deals up to 50% faster than traditional procurement.
Frequently Asked Questions
What is a good payback period for commercial solar in India?
A 4-6 year payback period is considered strong for C&I solar in India given high grid tariffs, strong irradiance, and available tax benefits. Since the asset lifespan is 25 years, businesses enjoy 19-21 years of near-free power after payback.
How does accelerated depreciation reduce the solar payback period for businesses?
Under India's Income Tax Act, businesses can claim 40% accelerated depreciation on solar assets in Year 1, reducing net system cost through a tax shield. For companies taxed under Section 115BAA, this saves approximately 10% of system cost upfront — the actual benefit scales with your tax bracket.
What is the difference between solar payback period and solar ROI?
Payback period measures how long to recover the initial investment (typically 4-6 years), while ROI measures total profit over the system's 25-year life as a percentage of invested capital (typically 200-400%). Both metrics are useful but answer different financial questions.
Does net metering affect the solar payback period for industrial consumers in India?
Net metering allows surplus energy to be credited against grid bills, improving annual savings and shortening payback. However, many states have caps or restrictions on net metering for large industrial consumers (often 500 kW to 1 MW limits), which must be verified state-by-state before sizing your system.
Is there a payback period in a Corporate PPA model?
In a PPA model, the business doesn't own the asset, so there's no traditional payback period. Savings begin from Day 1 — the PPA tariff (₹3.5-5.0/kWh) runs well below typical grid tariffs (₹8-12/kWh), and value is measured through cumulative savings over the 15-25 year contract.
Which states in India offer the fastest solar payback periods for industries?
States with high commercial tariffs (Maharashtra, Tamil Nadu, Karnataka) combined with strong solar irradiance tend to yield the fastest payback periods — typically 3.5-5 years. However, actual payback depends on your specific tariff, consumption profile, and system design.