Introduction
Energy costs represent one of the largest operational expenses for Indian Commercial & Industrial (C&I) businesses—in energy-intensive sectors like data centres, electricity comprises 30-60% of total operating costs, and in some cases up to 65%. Yet most procurement decisions are still made using fragmented, outdated information: static tariff sheets, manual RFP processes, and gut instinct.
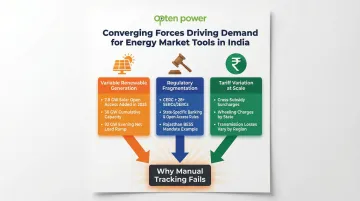
The gap is widening. India's electricity market is governed by 28+ State Electricity Regulatory Commissions (SERCs), each with distinct open access rules, wheeling charges, banking policies, and cross-subsidy surcharges. Tariff orders and policy amendments are issued asynchronously across states—practically impossible for a 3-5 person procurement team to track manually.
The result is predictable: C&I buyers either overpay for grid power or sign PPAs at above-market rates.
What follows breaks down the major categories of energy market analysis tools, the features that matter for procurement and cost optimization, and why India's multi-state regulatory complexity demands a different class of tool.
Key Takeaways
- Energy market analysis tools track tariffs, compare procurement options, model ROI, and accelerate energy decisions
- Key tool categories span real-time pricing intelligence, AI forecasting, portfolio dashboards, and procurement automation — each solving a distinct bottleneck
- For Indian C&I buyers, critical features are Discom-level tariff accuracy, open access regulatory intelligence, and instant IRR/payback modelling
- The right tool cuts decision time, eliminates overpaying, and gives full visibility over energy spend and renewable commitments
What Are Energy Market Analysis Tools?
Energy market analysis tools are software platforms and data systems that aggregate, process, and visualize energy pricing, demand, regulatory, and supply data to support procurement, investment, and operational decisions.
These tools serve a spectrum of users, each with different data needs:
- Commodity traders track spot prices and hedge exposure across power exchanges
- C&I energy managers compare long-term PPA rates across multiple states and developers
- Renewable developers benchmark project viability and tariff competitiveness
Why the Need Has Intensified
The need for these tools has grown due to three converging forces:
- Variable renewable generation: India added 7.8 GW of solar open access capacity in 2025 alone, pushing cumulative installed capacity beyond 30 GW. Midday solar surplus drives price cannibalization, while a 92 GW evening net load ramp forces coal and hydro to rapidly compensate as solar drops off.
- Regulatory fragmentation: India's electricity market operates under CERC and 28+ SERCs and JERCs. Each state sets its own rules on open access eligibility, banking policies, and charges. Rajasthan, for instance, now mandates 20% BESS integration for captive plants oversized beyond 100% contract demand.
- Tariff variation at scale: Cross-subsidy surcharges, wheeling charges, and transmission losses differ significantly across states. These variables are too numerous to track manually — yet they determine whether a PPA is financially viable.
Key Categories of Energy Market Analysis Tools
Real-Time Pricing and Tariff Intelligence Platforms
These tools aggregate live electricity pricing data—including Discom landing costs, transmission charges, and open access surcharges—across multiple states or market zones. They enable procurement teams to compare the true cost of different supply sources without manual research.
Accurate pricing data is the foundation on which every other analysis layer depends. In India, open access landed costs consist of the base PPA tariff plus a web of state-specific charges: Cross-Subsidy Surcharge (CSS), Additional Surcharge (AS), wheeling charges, and transmission losses. Without real-time, standardized data, procurement teams cannot calculate accurate savings.
AI-Powered Commodity and Energy Forecasting Tools
Platforms using natural language processing (NLP) and machine learning scan thousands of market signals—policy announcements, weather patterns, fuel price movements, regulatory notifications—to generate price trend forecasts and demand projections.
Machine learning models demonstrate clear superiority in Indian microclimates:
| Forecasting Model | Application | Performance Metric | Key Finding |
|---|---|---|---|
| XGBoost | Solar Power Generation | RMSE: 45.2, R²: 0.97 | Outperformed LSTM by handling complex, nonlinear relationships |
| LSTM | Solar Power Generation | RMSE: 152.6, R²: 0.69 | Struggled to capture patterns in solar power variations |
The shift from rule-based models to ensemble ML approaches—combining fundamental analysis with sentiment data—has produced measurable gains in forecast accuracy for Indian power markets.
Predictive Demand and Load Analytics Tools
These tools analyze a business's own consumption patterns using time-series interval meter data to identify peak load signatures, wastage windows, and demand response opportunities. This feeds directly into PPA structuring and tariff optimization decisions.
India's Revamped Distribution Sector Scheme (RDSS) is driving a massive smart meter rollout. The scale of deployment creates a new data foundation for load analytics:
- As of March 2024, 94.29% of India's 34.18 crore consumers are metered
- Target: 250 million prepaid smart meters installed by March 2026
- Smart meters capture data at 15-minute intervals, enabling granular electricity accounting and real-time matching of energy use with renewable generation
Portfolio Management and Monitoring Dashboards
Unified dashboards give energy managers a consolidated view of all their renewable assets, procurement contracts, and cost performance across sites and states. They cover contracted vs. actual generation, financial performance against benchmarks, and contract milestone tracking.
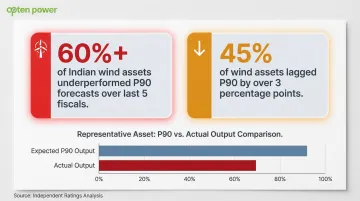
This monitoring capability is critical: Independent ratings reveal that over 60% of Indian wind assets have underperformed P90 forecasts over the last five fiscals, primarily due to unpredictable wind speeds. As high as 45% of wind assets lagged their P90 level by over 3 percentage points. Without specialized monitoring tools, a C&I buyer has no early warning when contracted output starts drifting—and no leverage to act before those gaps hit their balance sheet.
Procurement and Tender Automation Platforms
Once monitoring flags underperformance or new capacity needs, procurement tools accelerate the response. Automated RFP/tender engines replace weeks of manual outreach with structured templates and pre-vetted developer pools—cutting deal timelines by up to 50%.
Must-Have Features in an Energy Market Analysis Tool
Real-Time, Location-Specific Tariff and Regulatory Data
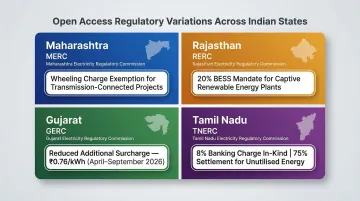
The tool must provide current, standardized landing prices at the state and Discom level—not national averages. Open access charges, cross-subsidy surcharges, and wheeling costs vary enormously by state:
| State | Regulatory Body | Key Open Access Charge / Rule Variation |
|---|---|---|
| Maharashtra | MERC | Exempts wheeling charges for transmission-connected open access projects |
| Rajasthan | RERC | Mandates BESS (min 20% storage) for captive RE plants sized between 100% and 200% of contract demand |
| Gujarat | GERC | Reduced additional surcharge to ₹0.76/kWh for open access consumers (April-Sept 2026) |
| Tamil Nadu | TNERC | Banking charges fixed at 8% of banked energy in kind; unutilised banked energy settled at 75% of relevant tariff |
Stale tariff data doesn't just cause delays—it produces savings projections that are wrong from the start, leading procurement teams to commit to contracts based on numbers that no longer reflect actual costs.
Instant Financial Modelling (IRR, Payback, and Savings Analysis)
Procurement teams evaluating multiple developer proposals simultaneously need IRR, payback period, and projected savings generated in real time—not after a multi-week consultant engagement. Waiting weeks for financial modelling means decisions get made on incomplete comparisons, or not at all.
Platforms like Opten Power's deliver this analysis in seconds, compressing what traditionally required external consultants into a single dashboard action.
Multi-Developer and Multi-Option Comparison
The tool should allow side-by-side comparison of tariff rates, savings projections, and contract terms across several developers simultaneously, eliminating the sequential RFP approach that slows decisions and introduces information asymmetry in favour of developers.
Integration of Regulatory and Compliance Intelligence
Good tools automatically surface relevant policy changes—RPO targets, banking charges, net metering caps, open access policy amendments—so procurement teams don't miss regulatory shifts that affect contract economics.
This matters more in India than almost anywhere else. State-level policy can shift with minimal notice, and the gap between central rules and state implementation is wide. The Green Energy Open Access (GEOA) Rules set banking charges in kind at 8%, but states have interpreted this differently: Rajasthan adopted a yearly banking period, while Gujarat implemented daily banking for solar power.
Portfolio-Level Visibility and Performance Tracking
Once contracts are signed, the tool should shift from decision-support to ongoing monitoring. That means:
- Tracking actual vs. projected generation across all assets
- Identifying underperforming projects before they breach contract thresholds
- Flagging regulatory non-compliance in real time
- Maintaining a single source of truth across the enterprise's full renewable portfolio
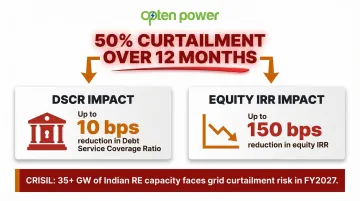
The financial impact of poor monitoring is severe. An average curtailment of 50% over 12 months can impact project Debt Service Coverage Ratios (DSCRs) by up to 10 bps and equity IRR by up to 150 bps. CRISIL warns that more than 35 GW of renewable energy capacity in India could face grid curtailment risk in fiscal 2027 due to limited long-term transmission access.
Why Indian C&I Buyers Need Specialized Energy Market Tools
India's Multi-State Regulatory Complexity Demands Local Precision
Unlike Western markets where federal-level pricing is more standardised, India has 28+ state electricity regulatory commissions, each with distinct open access rules, wheeling charges, banking policies, and RPO obligations.
A generic global energy analytics platform built for European or US power markets cannot reflect this granularity, making India-specific tools a functional necessity rather than a preference.
The Volume and Pace of Discom Policy Changes Creates a Data Problem at Scale
Discom tariff orders, open access notifications, and cross-subsidy surcharge revisions are issued asynchronously across states—making it practically impossible for a 3-5 person energy procurement team to stay current manually.
Tools that automate this intelligence aggregation free procurement teams to focus on decisions rather than data collection.
C&I Buyers Are Leaving Significant Cost Savings on the Table Without Analytical Tools
Without real-time tariff benchmarking and multi-developer comparison, most C&I buyers either overpay for grid power (not knowing open access is viable in their state) or sign PPAs at above-market rates (not having simultaneous bids to benchmark against).
States offering rebates on cross-subsidy, wheeling, and state transmission utility charges for intra-state power sourcing have lowered the landed cost of power compared with on-grid tariffs by 25–30%. C&I consumers who fail to adopt open access where viable are effectively paying that premium unnecessarily.
Scheduling risk compounds this further. Under the CERC Deviation Settlement Mechanism (DSM) rules, the no-deviation penalty window was tightened to 15% (+5% over to -10% under)—meaning uninformed scheduling decisions translate directly into financial penalties.
Opten Power's Platform as a Purpose-Built Solution for This Context
Opten Power is built to address these specific challenges. As India's unified clean energy marketplace, the platform gives C&I buyers the tools to act on intelligence rather than chase it:
- Real-time Discom intelligence standardised across 16 states
- Access to 4+ GW of renewable capacity from India's leading power producers
- Automated tender engine for comparing tariffs, savings, and ROI across multiple developers simultaneously
- Deal closure times cut by up to 50% through pre-approved contracts and modular RFP templates
How to Choose the Right Energy Market Analysis Tool
Match Tool Depth to Your Decision Type
A C&I buyer benchmarking open access feasibility in two or three states needs something very different from a large enterprise managing 50 MW of contracted renewable capacity across multiple Discom jurisdictions.
Simple decision framework:
- Volume of procurement decisions per year: High-frequency decisions require automated RFP engines; occasional decisions may only need tariff benchmarking
- Number of states in scope: Operations spanning multiple states need tools that track SERC regulations and Discom tariffs across jurisdictions; single-state buyers can use simpler tools
- Pre-contract vs. post-contract needs: Pre-contract analysis requires financial modelling and developer comparison; post-contract needs require portfolio management and performance tracking
Evaluate Data Freshness and Source Transparency
When evaluating any platform, ask vendors directly:
- How often Discom tariffs and open access charges are updated
- Which primary sources (SERCs, state nodal agencies) feed the platform
- Whether policy change alerts are triggered for your operational states
Stale data invalidates financial models and can expose businesses to regulatory penalties. Freshness and source transparency are non-negotiable.
Prioritize Platforms That Combine Intelligence with Action
The most valuable tools are not just dashboards for viewing data but platforms that connect analysis directly to procurement action—where a tariff comparison can flow into an RFP, and an IRR model can be shared with a developer in the same workflow.
When analysis and execution live in the same platform, deal timelines shorten and errors from manual re-entry disappear.
Frequently Asked Questions
What are the top market intelligence tools for the energy industry?
The main categories are AI-powered forecasting platforms, real-time pricing intelligence tools, portfolio management dashboards, and procurement automation systems. The right fit depends on your role—traders, C&I buyers, and renewable developers each need different data layers and analytical depth.
What are AI agents for the energy industry?
AI agents in energy are autonomous software systems that continuously monitor market signals, policy changes, and pricing data to surface actionable recommendations. A trader might receive price movement alerts, while a C&I energy manager gets signals on the best window to lock in procurement.
How do energy market analysis tools help reduce procurement costs?
These tools reduce costs by revealing true Discom landing prices, enabling multi-developer tariff comparisons, and identifying open access viability. They prevent businesses from overpaying due to information gaps—businesses switching from grid tariffs to open access typically save 25-30% where viability is confirmed.
What features should I look for in an energy market analysis tool for renewable procurement?
Core features include real-time state-level tariff data, instant IRR and payback modelling, multi-developer comparison capability, and automated regulatory intelligence. Together, these let you compare developers on numbers—not promises—and avoid locking into unfavourable terms.
Can energy market analysis tools be used for both short-term and long-term decisions?
Yes, well-designed tools serve both. Real-time pricing data drives immediate grid vs. open access calls, while financial modelling and portfolio dashboards handle 10-25 year PPA structuring and multi-site asset management.