Introduction
Solar sales commissions are straightforward until a Power Purchase Agreement enters the picture. PPAs change the math entirely — how deals are valued, when you get paid, and what clauses can claw back earnings you thought were already yours.
This guide is written for solar sales professionals navigating C&I deals, channel partners structuring compensation plans, C&I businesses evaluating PPA proposals, and developers designing sales incentive programs.
We cover commission structures by role, PPA-specific calculation methods, and the contractual clauses that either protect your earnings or quietly reduce them.
What Is Solar Sales Commission?
Solar sales commission is the percentage or fixed amount a sales representative earns from a successfully closed solar deal — whether that's a direct system sale or a long-term PPA contract. How that commission is calculated, however, depends entirely on the deal structure.
Two deal types, two different bases:
- Direct system sale: Commission is a percentage of total system cost (hardware, installation, permits)
- PPA deal: Commission is based on the total contract value — the cumulative revenue the developer earns over 10–25 years — or on a per-megawatt capacity fee
Industry-standard commission ranges:
The typical commission range is 3%–10% of system or contract value, with 5%–8% being the most common across markets. Residential deals tend to carry higher commission percentages due to shorter, simpler sales cycles — but for context only, since most enterprise solar activity sits in the commercial and industrial (C&I) space. C&I projects involve longer cycles and lower percentages, but higher absolute payouts given project scale.
Three primary roles that earn commissions:
- Canvassers/Lead Generators: Typically earn a flat fee per qualified appointment set (₹500–₹2,000 per qualified lead in India)
- Sales Representatives: Primary earners who close deals and receive the largest commission share
- Territory/Account Managers: Earn override or rollup commissions based on their team's performance, often 1%–3% on top of individual rep commissions
How PPAs Change the Solar Sales Commission Equation
In a direct system sale, commission is simple: a percentage of a one-time system cost. A Power Purchase Agreement (PPA) works differently. The developer owns and operates the system; the customer pays a per-unit electricity rate over a long contract term — typically 15–25 years in India, 10–25 years in global markets. That shift in deal structure changes the commission math entirely.
PPA Pricing Models and Their Impact on Commission
Two main PPA pricing structures dominate the market:
Fixed-rate tariff: The customer pays the same unit price (₹/kWh) throughout the contract term. This creates a predictable commission base calculated as unit rate × projected annual consumption × contract term.
Escalating tariff: The price rises by a set percentage annually, typically 2%–5% per year. Escalating tariffs inflate total contract value over time, which may yield higher commissions. For example, a 25-year PPA starting at ₹4.50/kWh with a 3% annual escalator produces a much larger total contract value than a fixed ₹4.50/kWh rate.
How Commission Is Typically Calculated in PPA Deals
In PPA deals, commission is often calculated as a percentage of the total contract value (unit rate × projected annual consumption × contract term in years) or as a fixed fee per MW contracted. Some developers also pay per-unit commissions (for example, a fixed amount per kWh or per MW of capacity secured).
Example calculation:
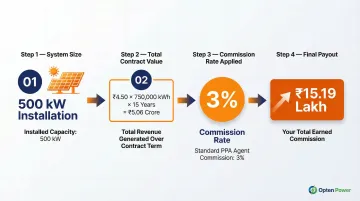
- 500 kW system
- ₹4.50/kWh tariff
- 15-year contract
- Projected annual generation: 750,000 kWh
- Total contract value: ₹4.50 × 750,000 kWh × 15 years = ₹5.06 crore
- Commission at 3%: ₹15.19 lakh
Even at a lower percentage, C&I PPA deals in markets like India involve larger capacities — so even a modest percentage translates to substantial absolute earnings.
Corporate PPAs in India — What's Different
Those commission numbers don't exist in a vacuum. India's C&I solar PPA market operates under a regulatory framework that directly shapes deal structure, competitive pricing, and ultimately what gets paid to sales teams. Key factors affecting PPA commission structures include:
- Open access regulations: The Electricity Act, 2003, mandates non-discriminatory open access for transmission and distribution systems
- DISCOM landing prices: Regional electricity tariff baselines that determine PPA competitiveness
- State-level policies: Cross-subsidy surcharges (CSS), additional surcharges (AS), wheeling charges, and banking policies vary significantly by state
- Procurement models: Captive, group captive, and third-party sale models each carry different regulatory and financial implications
Market growth: India added a record 6.9 GW of solar open access capacity in 2024, a 77% year-over-year increase, bringing cumulative capacity to 20.2 GW with a 25.7 GW pipeline. For commercial solar sales professionals, that 77% growth rate signals a market still in acceleration — not saturation.
Group captive dominance: To avoid high cross-subsidy surcharges, the Indian C&I market heavily utilizes group captive models, requiring consumers to hold at least 26% project equity and consume 51% of generated power.
Navigating this regulatory complexity is where deal speed gets lost. Opten Power addresses this directly: buyers can compare PPA tariffs, savings, and IRR across multiple developers in real-time across 16 states, with instant regulatory impact analysis built in. Sales teams working with better-informed buyers close deals faster — Opten Power's data puts that improvement at up to 50%.
Common Solar Sales Commission Structures
Commission structures vary by role, deal type, market, and company policy. Understanding how each model works helps reps negotiate better agreements — and helps companies design plans that actually drive results.
Flat-Rate Percentage
The simplest model: a fixed percentage of total system cost or PPA contract value.
- Typical range: 3%–10% (most commonly 5%–8%)
- Advantage: Predictable and easy to calculate
- Limitation: Does not reward volume or complexity
Example:
- 1 MW PPA deal
- Total contract value: ₹10 crore
- Commission rate: 4%
- Payout: ₹40 lakh
Tiered Rate by Volume
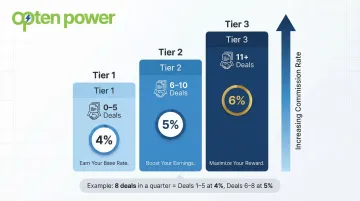
Commission percentage increases as the rep closes more deals or contracts more MW within a period.
- 0–5 deals: 4% commission
- 6–10 deals: 5% commission
- 11+ deals: 6% commission
This incentivizes higher sales activity and is common in markets with large deal pipelines.
Example: If a rep closes 8 deals in a quarter, the first 5 earn 4% commission and deals 6–8 earn 5% each — increasing per-deal earnings as volume grows.
Milestone-Based Split
A portion is paid at contract signing and the remainder at installation completion or Permission to Operate (PTO). In PPA deals, this might be: a portion at financial close and the remainder at commercial operation date (COD).
Typical split: 30% at signing, 70% at PTO or COD.
- Why companies prefer this: Reduces cancellation risk by tying final payout to project completion
- What reps should watch for: Long lag between signing and COD affects cash flow — ensure your agreement clearly defines milestone triggers and timelines
Per-kW or Per-MW Commissions
Output-based model where reps earn a fixed amount per kW (residential/small commercial) or per MW (utility/large C&I) contracted. This model is common in large C&I and industrial solar sales where deal sizes are measured in megawatts.
Example:
- 5 MW C&I deal
- Commission: ₹2 lakh per MW
- Total payout: ₹10 lakh
Base Salary Plus Commission Hybrid
Used when sales cycles are long, markets are new, or roles focus on account management. Provides income stability while retaining performance incentives.
Example:
- Base salary: ₹6 lakh/year
- Commission: 3% of contract value
- Total compensation: Base + variable commission
Territory managers in solar typically use this model, with override or rollup commissions of 1%–3% of team sales added on top.
How Much Can Solar Sales Reps Earn?
Earnings vary significantly based on role, market, deal type, and experience.
Earnings Tiers in India
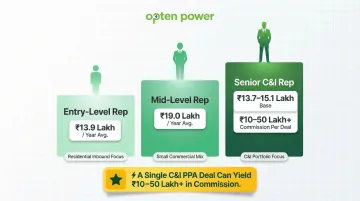
Entry-Level Reps (residential, inbound leads, lower deal values):
- Average gross salary: ₹13.9 lakh/year, with average bonus of ₹3.0 lakh
- Focused on small rooftop systems and inbound lead conversion
Mid-Level Reps (mix of residential and small commercial, self-generated leads):
- Average salary: ₹19.0 lakh/year
- Handle small commercial projects and generate own leads
Senior/Commercial Reps (large C&I and industrial deals, complex PPA negotiations):
- Base salary: ₹13.7–₹15.1 lakh/year for salaried manager roles — commission income is where senior reps pull ahead significantly
- Single deals can yield ₹10–₹50 lakh+ in commission
Variables That Drive Earnings Higher
- Geographic market: High solar adoption states like Maharashtra (18% of 2024 installations), Rajasthan (15%), and Karnataka (14%)
- Deal type: C&I PPA deals carry higher total contract values than residential direct sales
- Lead source: Self-generated leads typically earn higher commissions than company-provided leads
- Seniority/experience: Faster close rates, better qualification, stronger negotiation skills
In the Indian C&I market, a single PPA deal can involve 1–10 MW or more — mega-deals like Amazon's 210 MW agreement with ReNew Power represent the upper end. At that scale, commission per deal dwarfs anything available in residential sales. For reps who can navigate industrial energy procurement, commercial solar is where the real earning potential sits.
How to Calculate Solar Sales Commission (Step-by-Step)
Before running any numbers, identify what type of deal you're working with — this determines which formula applies.
Step 1 — Identify the Commission Basis
- Direct system sale (equipment + installation + permits):
Commission = System Cost × Commission %
- PPA (% of total contract value or fixed per-MW fee):
Total Contract Value = Unit Rate × Annual Generation × Contract TermCommission = Total Contract Value × Commission %- OR:
Commission = Capacity (MW) × Per-MW Fee
Step 2 — Determine the Applicable Commission Rate
Once you know the deal type, pull up your company's commission structure and apply the right rate:
- Flat rate: use the standard percentage (e.g., 5% of system cost)
- Tiered rate: check your current monthly or quarterly volume to confirm your tier
- Per-kW/per-MW: apply the fixed amount per capacity unit
- Role-based rates: canvasser, rep, and manager rates differ — use the one that applies to you
- Lead source: inbound leads often carry lower rates than self-generated ones
Step 3 — Apply Payout Triggers
Most plans release commission in stages tied to project milestones, not as a single lump sum:
- Milestone splits (e.g., 30% at signing / 70% at PTO or COD): calculate each portion separately
- Track trigger dates so you can forecast when each payment lands
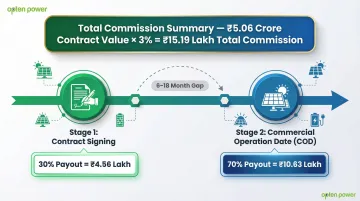
Example: 500 kW PPA Deal
- Unit rate: ₹4.50/kWh
- Annual generation: 750,000 kWh
- Contract term: 15 years
- Total contract value: ₹4.50 × 750,000 × 15 = ₹5.06 crore
- Commission rate: 3%
- Total commission: ₹15.19 lakh
- At signing (30%): ₹4.56 lakh
- At COD (70%): ₹10.63 lakh
Step 4 — Account for Adjustments
Your calculated commission is a starting point — these adjustments move the final number up or down:
- Clawback clauses: cancellations or installation failures may require you to return part of the commission
- Quota multipliers: hitting 120%+ of target often triggers a bonus percentage on all deals in that period
- Upsell bonuses: hybrid systems, extended contract terms, or additional capacity can add incremental payouts
- Deductions: company-subsidized financing or assigned leads may reduce your base rate
Key Commission Clauses Every Solar Sales Rep Should Know
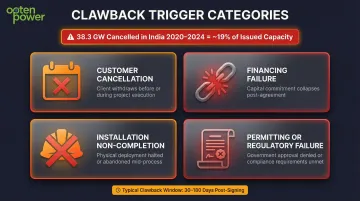
Clawback and Cancellation Clauses
Most solar commission plans include provisions requiring reps to return commissions if a deal is cancelled, refunded, or installation doesn't proceed.
Typical clawback windows: 30–180 days after contract signing
Triggers include:
- Customer cancellation within cooling-off period
- Financing failure or rejection
- Installation rejection or non-completion
- Permitting or regulatory failure
Context: From 2020 to 2024, 38.3 GW of utility-scale renewable energy capacity was cancelled in India — about 19% of total issued capacity during that period. Each of those cancellations represents a potential clawback event for the sales reps involved, making these clauses a direct financial risk — not just contractual fine print.
PTO and COD Dependencies
Clawback clauses aren't the only payout risk. Full commission is often contingent on the system reaching operational status — meaning payment follows the project, not just the signature:
- PTO (Permission to Operate): Granted by local authorities once installation is complete and inspected — standard for residential and small commercial systems
- COD (Commercial Operation Date): Declared after a successful trial run for utility-scale and large C&I PPA projects. For solar, this means confirmed power flow, metering, and telemetry operating across a full sunrise-to-sunset cycle
Impact on reps: This lag between signing and final payout directly affects cash flow planning. For large projects, COD can occur 6–18 months after contract signing.
Lead Source and Territory Clauses
Most commission plans distinguish between:
- Inbound company-provided leads: Lower commission rate (e.g., 3%–4%)
- Self-generated leads: Higher commission rate (e.g., 6%–8%)
Territory exclusivity clauses: Define which deals a rep is eligible to earn on based on geographic boundaries or customer ownership.
Key question to ask: Does your contract define which leads you "own" if you move to a competitor or leave the company?
Frequently Asked Questions
How to calculate solar commissions?
Solar commission is calculated by multiplying the applicable commission rate (typically 3%–10%) by the commission basis — either total system cost for direct sales or total PPA contract value (unit rate × annual consumption × contract term) for PPA deals. Payout may be split across milestones such as contract signing and system commissioning.
What is a typical solar sales commission percentage?
In commercial and industrial solar, commission rates typically range from 3%–8% of deal value, or fixed per-kW/per-MW fees for larger projects. While the percentage may be lower than residential deals, absolute earnings per C&I deal are far higher due to larger system capacities and contract values.
How does a PPA affect solar sales commission?
In a PPA deal, commission is not based on a one-time system cost but on total long-term contract value or a per-MW capacity fee. This means PPA commissions are larger in absolute terms but are often paid in stages tied to financial close and commercial operation milestones.
What is the difference between residential and commercial solar commissions?
Residential deals usually offer higher commission percentages with quicker payout cycles. Commercial and industrial deals offer lower percentages but far larger absolute commissions due to higher system capacities and contract values.