Introduction
Commercial solar adoption in India is accelerating among C&I businesses, driven by rising grid tariffs, sustainability mandates, and favourable policy tailwinds. India added a record 7.8 GW of open access and 7.1 GW of rooftop solar in 2025, reflecting unprecedented growth in the sector. Yet the path from decision to commissioning is more complex than most businesses anticipate.
Unlike residential solar, commercial projects involve higher capital, multi-stakeholder processes, state-specific regulatory frameworks, and long-term contractual commitments. Ignoring these upfront complexity factors has real financial consequences. Industrial tariff rates in states like Maharashtra rank among the highest nationally, pushing businesses toward solar — yet without navigating the regulatory maze, financial modelling gaps, and technical constraints, initial savings projections often fall short.
Understanding where projects stall — and why — is the first step to protecting your investment. This guide breaks down the most critical challenges across regulatory, financial, technical, and operational dimensions, with practical guidance on how businesses can address each one.
Key Takeaways
- Regulatory complexity: State-wise variations in net metering caps and open access charges create permitting hurdles
- Financial uncertainty: Without IRR analysis, choosing between CapEx, PPAs, and RESCO models leads to suboptimal deals
- Technical gaps: Inadequate site assessments and grid interconnection issues delay timelines and erode ROI
- Procurement fragmentation: No structured developer evaluation process means leaving significant savings on the table
- O&M blind spots: Skipping active monitoring drives steady performance degradation across a 25-year asset life
Regulatory and Policy Complexity
India's solar regulatory environment is highly fragmented. While central policy provides the framework through MNRE guidelines and RPO obligations, implementation varies significantly across states. Each DISCOM sets its own rules on net metering caps, open access thresholds, wheeling charges, and banking charges.
Net Metering Cap Challenge
Many state DISCOMs have set capacity limits on net metering eligibility, pushing larger C&I consumers toward open access solar. State-level variations include:
- Maharashtra: Raised its net metering cap to 5 MW or sanctioned load (whichever is lower)
- Karnataka: Removed its previous 2000 kW restriction, now capping at sanctioned load or contract demand
- Tamil Nadu: Limits capacity to sanctioned load for all eligible consumers
These variations create planning complexity. C&I facilities must audit current sanctioned load against available shadow-free roof space to optimize system sizing. Any mismatch can push businesses into the open access route, which carries its own approval burdens.
Open Access Approval Bottleneck
Obtaining open access approval involves multiple regulatory bodies: SERC, STU, SLDC, and DISCOM. The process can take 6-12 months, with frequent delays due to inconsistent documentation requirements, connectivity studies, and queuing at the substation level.
The Green Energy Open Access framework requires:
- Central Nodal Agency (CNA) operating the GOAR portal
- State Transmission Utility (STU) processing bilateral long-term and medium-term applications
- State Load Despatch Centre (SLDC) handling registrations and short-term applications
- DISCOM facilitating non-discriminatory access to embedded entities
Each entity operates on different timelines and documentation standards, creating bottlenecks that extend project commissioning by months.
Policy Instability Creates Investment Risk
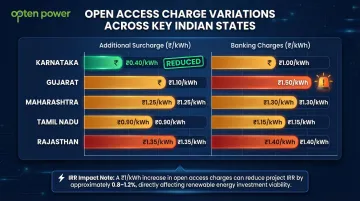
Retrospective changes to wheeling charges, cross-subsidy surcharges, or banking provisions have directly affected live project economics. Karnataka recently halved its Additional Surcharge to ₹0.4/kWh, down from ₹0.82/kWh, offering meaningful relief for open access consumers.
Gujarat, by contrast, retained banking charges of ₹1.5/kWh for open access consumers until June 2026, maintaining financial pressure on solar economics.
These fluctuations make long-term planning difficult. A project that looks viable on paper with current charges may become uneconomical if surcharges rise retroactively, directly impacting IRR and payback calculations that businesses rely on for capital allocation decisions.
Financial Structuring and ROI Uncertainty
C&I businesses in India have three main procurement models: CapEx (own and operate), RESCO/third-party ownership, and Corporate PPAs. Each has distinct risk profiles, balance sheet implications, tax treatment, and long-term obligations that businesses often underestimate.
CapEx vs. PPA Financial Comparison
| Financial Model | Typical Payback Period | Estimated IRR | Key Characteristics |
|---|---|---|---|
| CapEx (Consumer-Owned) | 3-5 years | ~12.9% | High upfront cost, maximum lifetime savings, eligible for 40% Accelerated Depreciation |
| PPA / RESCO (Third-Party) | N/A (Zero upfront cost) | 14-15% (for investor) | Zero upfront capital, predictable OPEX tariff (₹3.5-4/kWh) |
CapEx models deliver faster payback periods and higher lifetime savings, heavily supported by the 40% Accelerated Depreciation central tax benefit. Cash-rich entities should leverage CapEx for maximum returns. Risk-averse companies should opt for PPA models to avoid upfront costs and performance risks.
Corporate PPA Creditworthiness Challenge
PPA providers and developers require off-takers to demonstrate financial stability over 15-25 year contract durations through detailed credit assessments. Businesses with weaker credit ratings face less favourable PPA tariffs or stricter collateral requirements, raising the effective cost of financing.
Hidden Cost Problem in Financial Modeling
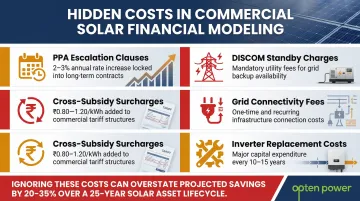
Many businesses evaluate solar purely on headline tariff savings but fail to account for:
- Escalation clauses in PPAs: Typically 2-3% annually
- DISCOM standby charges: Applied when grid backup is required
- Grid connectivity charges: One-time and recurring fees
- Cross-subsidy surcharges: Can range from ₹0.80-1.20/kWh
- Inverter replacement costs: Required after 10-15 years
These hidden costs lead to overstated savings projections, creating budget shortfalls and disappointing ROI outcomes.
Incentive Navigation Complexity
Central government incentives — particularly the 40% Accelerated Depreciation available under Section 32 of the Income-tax Act — and state-level subsidies vary by project type and timeline. Missing filing deadlines or failing to meet eligibility criteria significantly reduces financial returns.
Procurement compliance adds another layer of complexity. The MNRE's ALMM (Approved List of Models and Manufacturers) mandate is now strictly enforced. ALMM List-I (solar modules) is currently required, while ALMM List-II (solar cells) becomes mandatory for projects commissioned on or after June 1, 2026. This restricts procurement to approved domestic manufacturers, potentially impacting costs and timelines.
How Opten Power Simplifies Financial Decision-Making
Opten Power gives C&I businesses instant IRR, payback, and regulatory analysis across multiple developers and financing structures — without commissioning expensive consultants. Businesses can compare real-time tariffs and savings across CapEx, Group-CapEx, and Third-Party Open Access models on a single platform, cutting deal timelines by up to 50%.
Technical Challenges: Site, Infrastructure, and Grid Integration
Site Suitability Assessment
Site suitability assessment is the foundation of any commercial solar project, covering:
- Rooftop structural load capacity
- Panel tilt and orientation
- Shading analysis across seasons
- Available shadow-free area
- Age and condition of roofing membrane
Skipping or rushing this step leads to underperforming systems or expensive retrofits later. Rooftop installations must comply with structural standards — IS 2062 and IS 4759 define load-bearing capacity requirements that foundation design must satisfy.
Existing Infrastructure Integration Challenge
Most C&I facilities in India were not designed with solar in mind. Integration requires:
- LT/HT panel upgrades
- Meter replacement
- Protection relay coordination
- Cable sizing for new solar feeds
EPC contractors routinely exclude these items from initial quotes. When they surface during execution, the result is budget overruns and schedule slippage — sometimes weeks into a project.
Grid Interconnection Complications
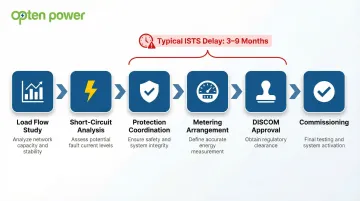
For open access or group captive projects, connecting to the grid substation involves multiple steps:
- Load flow and short-circuit studies
- Protection coordination with the utility
- Metering arrangements and approvals
Each step is technically demanding and administratively slow. Non-standardized procedures across states compound the problem — ISTS connectivity delays of 3–9 months are common, and often not factored into original project schedules.
Curtailment Risk
In states with high renewable penetration or grid congestion, DISCOMs may curtail solar generation. Between May and December 2025, India curtailed 2.3 TWh of solar generation due to grid security concerns and transmission constraints.
Rajasthan was particularly affected: nearly 4,300 MW of solar capacity faced complete daytime curtailment due to inadequate transmission infrastructure. Even a well-designed system will miss projected energy yields under curtailment — directly impacting PPA commitments and ROI. Some generators received partial compensation through emergency Tertiary Reserve Ancillary Services (a grid-balancing mechanism), but curtailment remains a real and recurring financial exposure for C&I buyers.
Developer Selection and Procurement Challenges
The Indian commercial solar market has a fragmented developer landscape — hundreds of EPC companies, IPPs, and RESCO providers of varying scale and technical capability. This makes it difficult for C&I buyers to identify credible, financially stable developers capable of delivering and servicing projects over a 25-year horizon.
Market Fragmentation
| Market Segment | Leading Developers | Market Dynamics |
|---|---|---|
| Utility-Scale / Open Access | Adani Green Energy, NTPC Green Energy, SJVN Green Energy | Top 5 developers account for 47% market share |
| Rooftop Solar | Tata Power Solar, Amplus, Fourth Partner | Highly fragmented; "Others" account for 73.9% market share |
The vast majority of rooftop installations are handled by smaller, unranked EPCs — which means due diligence on developer credentials, financial health, and O&M track record is non-negotiable before signing any agreement.
RFP and Benchmarking Challenge
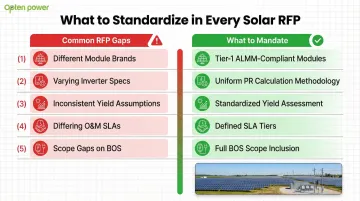
Without a structured procurement process, C&I buyers typically receive quotes that can't be compared on equal terms:
- Different module brands and specifications
- Varying inverter specs and warranties
- Inconsistent yield assumptions
- Different O&M terms and SLAs
- Scope gaps regarding structural works and Balance of System components
The result: buyers can't accurately compare developer offers, which weakens negotiating leverage and increases the risk of selecting on price alone. Mandating Tier-1 ALMM-compliant modules and a uniform Performance Ratio calculation methodology in every RFP resolves this directly.
How Structured Platforms Address These Gaps
Marketplaces like Opten Power address the fragmentation problem by giving C&I buyers access to pre-vetted developers across 4+ GW of renewable capacity in 16 states — all on a single platform.
Standardized PPA templates covering CapEx, Group-CapEx, and Third-Party Open Access models ensure legal and commercial terms are comparable from the start, cutting the time from shortlist to signed agreement by up to 50%.
Long-Term O&M and Stakeholder Management
Commercial solar systems carry 25-year lifespans, but many businesses underinvest in O&M planning at the outset. Failing to budget for periodic panel cleaning, inverter maintenance, string-level monitoring, performance ratio tracking, and eventual module replacement compounds into measurable energy production losses across the asset's life.
O&M Agreement Best Practices
Structure O&M agreements at the time of signing the EPC or PPA contract to include:
Performance Guarantees:
- Guaranteed Performance Ratio (GPR) directly tied to energy output
- Annual degradation allowances based on module warranties
- Minimum availability targets (typically 97-98%)
Response Time SLAs:
- Critical faults (100% plant outage): 4-8 hour response
- Major faults (significant capacity loss): 24-48 hour response
- Minor faults: Scheduled during next maintenance visit
Monitoring System Requirements:
- Advanced SCADA platforms with IEC 61724 data acceptance criteria
- String-level monitoring for rapid fault detection
- Real-time performance ratio tracking
- Automated alerts for underperformance
Component Replacement Provisions:
- Inverter replacement schedule (typically 10-15 years)
- Module warranty insurance to safeguard against quality defects
- Balance of system component warranties and replacement terms
Internal Stakeholder Alignment Challenge
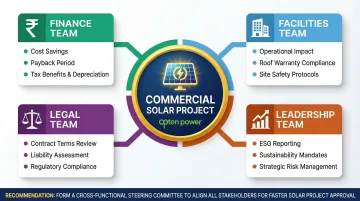
Commercial solar projects require coordinated buy-in from finance, facilities, legal, and leadership teams — each with different priorities:
- Finance: cost savings, payback period, and tax benefits
- Facilities: operational impact, roof warranty, and site safety
- Legal: contract terms, liability exposure, and regulatory compliance
- Leadership: ESG reporting, sustainability mandates, and risk management
Misalignment between these groups routinely causes project delays and poorly structured contracts. Forming a cross-functional steering committee early — before RFP issuance — gives each team a defined role in shaping contract terms, reducing the back-and-forth that stalls deals at the final approval stage.
Frequently Asked Questions
What are the challenges facing the solar industry?
The solar industry faces policy inconsistency across states, financing complexity in structuring long-term contracts, grid integration bottlenecks that delay commissioning, and technology performance variability over time. At commercial scale, these issues compound — regulatory compliance, capital allocation, and operational performance all carry direct financial consequences.
What is the biggest financial challenge in commercial solar projects in India?
Choosing between CapEx, PPA, and RESCO models without accurate IRR modeling is the most common financial pitfall. Businesses also underestimate hidden costs like wheeling charges (₹0.60-0.80/kWh), cross-subsidy surcharges (₹0.80-1.20/kWh), and 2-3% annual escalation clauses, which can erode projected savings over the contract term.
How long does it take to get permits and approvals for a commercial solar project in India?
Timelines vary widely by state and project type. Rooftop net metering approvals typically take 1-3 months for documentation and DISCOM coordination. Open access approvals can take 6-12 months or more depending on DISCOM workload, connectivity study timelines, and coordination across multiple regulatory bodies including SERC, STU, SLDC, and local DISCOMs.
What is the difference between rooftop solar and open access solar for commercial buyers?
Rooftop solar uses on-site generation with net metering and simpler approvals, but capacity is limited by available roof space and sanctioned load. Open access solar operates at larger scale off-site, wheeled through the grid to your facility — it carries additional wheeling and cross-subsidy charges but suits large consumers who've outgrown their rooftop capacity or lack suitable roof infrastructure.
How can businesses reduce risk when selecting a solar developer in India?
Start with structured RFPs using standardized technical specs and yield assumptions, then verify references from completed projects at similar scale. Conduct financial due diligence on the developer's balance sheet and track record. Procurement platforms like Opten Power aggregate pre-vetted developers so you can benchmark tariffs, contract terms, and performance guarantees in one place.
What should a commercial solar O&M agreement include?
A well-structured O&M agreement should cover:
- Performance Ratio guarantees tied to measured energy output
- Response time SLAs: 4-8 hours for critical faults, 24-48 hours for major faults
- Scheduled maintenance intervals with cleaning and inspection protocols
- Remote SCADA monitoring access with real-time performance data
- Inverter and component replacement provisions with clear cost allocation over the 25-year term