This guide cuts through the complexity. You'll learn what C&I solar is, how it differs from residential and utility-scale segments, which project types work best for your facility, the step-by-step development process, and the financing models that make sense for Indian businesses. By the end, you'll have a clear framework to evaluate whether C&I solar fits your energy strategy—and how to move forward.
TLDR:
- C&I solar systems (100 kW to 10 MW) reduce energy costs by 40% with levelized tariffs of ₹3.5-4.5/kWh versus grid rates of ₹7-14/kWh
- Businesses choose between behind-the-meter rooftop installations or open access models to source power from remote projects
- India added 6.9 GW of open access solar in 2024 (77% year-over-year increase), driven by new 100 kW eligibility thresholds
- Payback periods typically range from 3-4 years for CAPEX models with 40% accelerated depreciation benefits
- Platforms like Opten Power enable automated RFPs and real-time tariff comparisons across 4+ GW of capacity in 16 states
What Is C&I Solar? Understanding the Basics
C&I (commercial and industrial) solar refers to solar installations designed to serve the dedicated energy load of a business or industrial operation. Unlike utility-scale projects that sell power wholesale to the grid, or residential systems powering single homes, C&I solar is sized and configured around a specific company's consumption profile.
Capacity Range
C&I projects typically span 100 kW to 10 MW, bridging the gap between small residential rooftops (3–20 kW) and large utility-scale farms (25 MW and above). In India, the regulatory landscape changed significantly with the Green Energy Open Access Rules 2022 reduced the eligibility threshold from 1 MW to 100 kW, opening the market to mid-sized commercial and industrial consumers previously limited to rooftop installations.
Behind-the-Meter vs. Open Access
These two dominant models define how Indian businesses procure C&I solar:
- Behind-the-meter systems install solar panels directly at your facility (rooftop or ground-mounted), reducing on-site consumption immediately with no grid transmission
- Open access allows you to procure solar power from a remotely located project, transmitted through the state DISCOM network for wheeling and banking charges that vary significantly by state
How C&I Differs from Commercial and Utility-Scale Solar
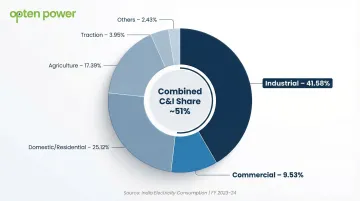
Many use "commercial solar" and "C&I solar" interchangeably, but there's a meaningful distinction. Pure commercial solar typically refers to office buildings, schools, hospitals, and retail spaces with modest daytime loads. C&I solar extends to heavy industrial users — manufacturing plants, steel mills, cement factories, data centres, warehouses — with substantially larger, more complex demand patterns.
The scale of that demand is significant. The industrial segment accounted for 41.58% of India's total electricity consumption in 2023–24, with the commercial sector adding another 9.53%. That consumption profile shapes how C&I projects are designed, with load matching, demand charge management, and grid interaction becoming critical engineering considerations — not afterthoughts.
Types of C&I Solar Projects
Rooftop Solar
Rooftop installations remain the most common entry point for C&I solar. If you operate a factory, warehouse, commercial complex, hospital, or IT park with large unshaded roof areas, rooftop solar offers immediate advantages: zero land acquisition costs, proximity to your consumption point, and straightforward installation.
India installed 3.2 GW of rooftop solar in 2024—an 86% increase from 2023. Within this, industrial facilities accounted for 19% and commercial buildings 6%. System sizes range from 100 kW for smaller commercial facilities to several megawatts for large manufacturing campuses.
Ground-Mount and Solar Carports
If your business owns open land (common for industrial campuses, agricultural operations, or facilities with unused plots), ground-mounted arrays offer greater flexibility in system sizing and orientation than rooftop constraints allow.
Solar carports suit businesses with extensive parking areas: manufacturing plants, hotels, large retail centres. They generate power while providing covered parking. For older buildings where structural integrity is a concern, thin-film or lightweight panels reduce roof loading requirements.
Open Access and Captive Power Projects
The Green Energy Open Access threshold reduction to 100 kW opened the market to mid-sized businesses that previously couldn't qualify. Now, companies above 100 kW consumption can source solar power from remotely located projects through the state grid.
Two structures dominate:
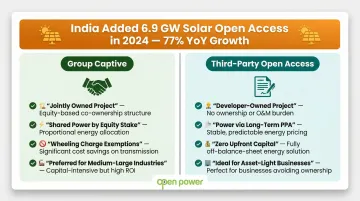
- Group Captive: Multiple businesses jointly own a solar project and share generated power based on equity participation. Offers wheeling charge exemptions and regulatory benefits — the preferred structure for medium to large industries.
- Third-Party Open Access: A developer owns the project; your business purchases power through a long-term PPA without owning the asset. Zero upfront capital required.
India added a record 6.9 GW of solar open access capacity in 2024—a 77% year-over-year surge. These models are particularly relevant for heavy industries and 24x7 operations that cannot meet full load from on-site generation alone. However, viability depends heavily on state-level charges: cross-subsidy surcharge, wheeling fees, banking charges, and additional surcharges vary significantly by state and can materially affect project economics.
Why C&I Businesses Are Going Solar: Key Benefits
Significant Reduction in Energy Costs
The Levelized Cost of Energy (LCOE) for rooftop solar in India now sits at approximately ₹3.5-4.5/kWh, compared to grid tariffs ranging from ₹7-14/kWh across major industrial states. Solar locks in predictable per-unit costs over 20-25 years, while DISCOM tariffs typically escalate 3-5% annually—compounding savings over time.
Demand Charge Savings
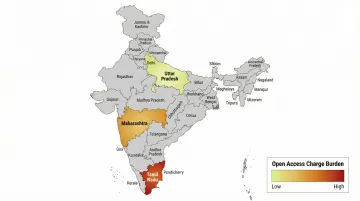
C&I electricity bills comprise two components: energy charges (per kWh consumed) and demand charges (per kW of peak demand). In Maharashtra, approved demand charges for HT Industry stand at ₹600/kVA/month. In Uttar Pradesh, HV-2 consumers face ₹330-425/kVA/month fixed charges.
Solar generation during peak hours directly reduces the demand component of your bill — a share that can be disproportionately large for energy-intensive operations. Because solar output varies, many C&I facilities pair it with battery storage to maintain those demand charge reductions through intermittent production periods.
Energy Independence and Operational Resilience
Unplanned downtime carries massive costs. An ABB survey reveals that 88% of Indian industrial businesses experience unplanned outages at least once monthly, costing the typical Indian business close to ₹7 million per hour.
For process industries, hospitals, data centres, and cold chains—where even brief outages trigger significant losses—solar provides critical backup capacity. Solar generation costs ₹6.5-10/kWh even during grid disruptions — far below diesel backup costs of ₹18-24/kWh — reducing both financial exposure and dependence on volatile grid supply.
ESG and Sustainability Advantages
Indian exporters face mounting carbon accountability. The EU's Carbon Border Adjustment Mechanism (CBAM) now requires detailed emissions reporting, pressuring sectors like textiles, chemicals, and auto components to demonstrate verifiable Scope 2 carbon reductions.
Solar directly reduces grid electricity-linked emissions. Using the CEA's CO2 Baseline Database (weighted average emission rate: 0.79 tCO2/MWh), every megawatt-hour of solar consumption eliminates nearly 800 kg of CO2 emissions. Over 23,100 companies globally now disclose environmental data through CDP. For businesses serving international buyers, that supply chain transparency is no longer optional — it's a procurement requirement.
Long-Term Asset and Property Value
These financial and regulatory benefits compound over time. Commercial PV systems are designed for 25-year operational lifespans, locking in cost advantages while grid tariffs continue to rise. For businesses that own their premises, solar also strengthens property value — improving energy efficiency ratings and making facilities more attractive to sustainability-conscious tenants and investors.
How a C&I Solar Project Comes Together: The Development Process
Step 1: Energy Audit and Load Analysis
Every viable C&I solar project begins with detailed energy analysis. You'll examine monthly electricity bills, load profiles, peak demand windows, and consumption patterns across seasons and production cycles.
This data determines optimal system size, configuration, and expected savings—and whether behind-the-meter or open access better suits your business. For instance, a textile mill running three shifts requires different design considerations than an office building with pure daytime consumption.
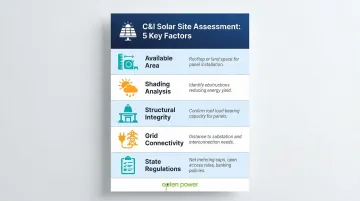
Step 2: Site Assessment and System Design
Technical feasibility hinges on multiple factors:
- Available area: Rooftop or land space for panel installation
- Shading analysis: Obstructions that reduce generation
- Structural integrity: Can your roof support panel loading?
- Grid connectivity: Distance to nearest substation and interconnection requirements
- State regulations: Net metering caps, open access rules, banking policies
System design must align generation with your consumption curve to maximize self-consumption and minimize energy lapse. Systems must be sized to match daytime load profiles to prevent uncompensated energy loss.
States like Maharashtra, Rajasthan, and Tamil Nadu now mandate monthly banking rather than annual, with 8% in-kind banking charges on banked energy—a regulatory detail that directly affects how aggressively you size your system.
Step 3: Procurement, Developer Selection, and RFP
The procurement process determines whether you secure competitive pricing or overpay. Traditional approaches involve manually issuing RFPs to developers, comparing technical specifications, evaluating tariff quotes, and negotiating O&M terms—a process that can stretch months.
Platforms like Opten Power have transformed this step. Businesses can run automated RFPs, compare real-time tariff quotes and IRR projections across multiple developers simultaneously, and access 4+ GW of available capacity across 16 states from a single dashboard. Pre-approved contract templates standardize complex legal terms, reducing negotiation friction and closing deals up to 50% faster.
Step 4: Installation, Commissioning, and Monitoring
EPC (Engineering, Procurement, Construction) execution for C&I rooftop projects typically takes 4-6 months from contract signing to commissioning. EPC costs for standard polycrystalline modules range from ₹32,000-36,000/kW, while advanced bifacial modules (which boost specific yield to 5-6 units/kW) cost ₹38,000-41,000/kW.
Post-commissioning, real-time performance monitoring protects your investment and keeps savings on track. Key tasks include:
- Tracking generation against projected output
- Monitoring system health and inverter performance
- Verifying actual savings against baseline bills
- Catching faults early before they compound into costly downtime
Financing Your C&I Solar Project in India
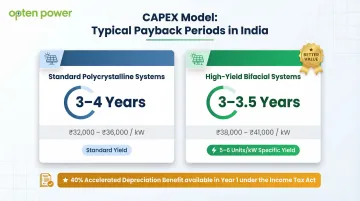
CAPEX (Direct Purchase)
The outright purchase model dominated 88% of India's rooftop solar installations in 2024. You own the system, claim 40% accelerated depreciation in the first year under the Income Tax Act, and maximize long-term savings with payback periods of:
- Standard systems: 3–4 years
- High-yield bifacial systems: 3–3.5 years
Best suited for businesses with strong balance sheets and sufficient tax liability to absorb depreciation benefits. The disadvantage: higher upfront capital requirement and longer commissioning timelines for bespoke solutions.
OPEX / Corporate PPA Model
Under a Power Purchase Agreement (PPA), a solar developer installs and owns the system on your premises (or at a remote site). You purchase solar power at a pre-agreed per-unit rate—typically lower than grid tariffs—with zero upfront investment.
PPA tenors in India typically range from 10-25 years with annual escalation clauses. Opten Power's marketplace lets businesses compare Corporate PPA tariffs and projected savings across India's top power producers, accessing 4+ GW of capacity across 16 states. This ensures you never overpay while eliminating capital deployment requirements.
The tradeoff: developers restrict OPEX models to highly creditworthy off-takers, limiting access for some MSMEs.
Financing and Leasing
Third-party financing lets businesses own assets over time while spreading upfront costs. Key options include:
- Public lenders (IREDA, SBI): concessional green financing with rates from 8–12% over 10–15 year tenors
- NBFCs and private equity funds: structured debt and equity instruments for larger C&I projects
Opten Power connects businesses with India's leading renewable energy developers and project options — enabling procurement across Capex, Group-Capex, and Open Access structures in one place.
Common Challenges in C&I Solar and How to Navigate Them
Regulatory and DISCOM Complexity
Open access approvals, net metering caps, state-level policy differences, and interconnection timelines create significant project delays. Gujarat allows net metering up to 1 MW, while Maharashtra permits up to 5 MW for high-voltage consumers — a gap that directly affects system sizing decisions.
Cross-subsidy surcharge (CSS), wheeling charges, and additional surcharges vary dramatically across states:
| State | CSS (₹/kWh) | Wheeling Charges (₹/kWh) | Typical Open Access Cost |
|---|---|---|---|
| Maharashtra | 1.78–1.82 | 0.60 | High CSS impact |
| Uttar Pradesh | 1.51–2.12 | 0.88 | Moderate combined levies |
| Tamil Nadu | 1.86–2.41 | 1.00–1.04 | Highest combined charges |
Choose partners with real-time visibility into state-level DISCOM tariffs and proven experience navigating multi-state approval workflows — not just familiarity with a single utility's process.
Space and Structural Constraints
Regulatory complexity is only part of the equation. Physical site limitations present a separate layer of challenge.
Not every facility has sufficient rooftop area or structurally sound surfaces for conventional panels. Practical workarounds include:
- Solar carports that double as covered parking infrastructure
- Thin-film panels for rooftops with low load-bearing capacity
- Open access procurement from remote projects when on-site generation falls short
Financing and ROI Complexity
Space constraints often push businesses toward hybrid procurement models — which adds another layer of financial complexity.
Evaluating CAPEX vs. OPEX, modeling IRR across a 25-year project life, and accounting for incentives, depreciation, and escalation clauses is difficult without specialist support. Platforms that surface IRR, payback period, and state-level regulatory costs upfront — before you engage a developer — help businesses compare options on a like-for-like basis and avoid committing to unfavorable terms.
Frequently Asked Questions
What is commercial and industrial solar?
C&I solar refers to solar energy systems designed to power the operations of commercial businesses and industrial facilities—distinct from residential solar (single homes) and utility-scale solar (grid supply). These systems typically range from 100 kW to 10 MW in capacity.
What are the types of commercial solar projects?
The main types include rooftop solar installations on commercial or industrial buildings, ground-mounted arrays on owned land, solar carports over parking areas, OPEX/PPA arrangements where a developer funds and owns the system while the business pays per unit consumed, and open access or captive power projects where businesses source solar from remotely located projects via the grid.
What materials are used for solar?
C&I solar systems primarily use monocrystalline or polycrystalline silicon panels, string or central inverters to convert DC to AC, mounting structures, and cabling. Monocrystalline panels dominate C&I projects due to their higher efficiency and smaller footprint requirements.
What is the difference between CAPEX and OPEX models for C&I solar?
In a CAPEX model, the business owns the solar system outright after paying upfront, capturing full depreciation benefits and long-term savings. In an OPEX or PPA model, a developer funds the installation and the business pays only for the units consumed — with zero capital expenditure and savings from the first bill.
What is the typical payback period for a C&I solar project in India?
For CAPEX models, payback periods in India typically range from 3 to 4 years, depending on system size, state tariffs, and accelerated depreciation benefits. High-efficiency bifacial systems can bring this down to 3–3.5 years. OPEX/PPA models require no upfront investment and generate savings immediately.
How does open access solar work for C&I customers in India?
Open access allows a C&I business to procure solar power from a project located anywhere in the same state (or other states under interstate open access), transmitted through the DISCOM network for wheeling and banking fees. This model is ideal for heavy industries needing more power than their rooftop can generate.