Introduction
Commercial solar adoption is accelerating across India, yet most decision-makers receive proposals that appear similar on the surface but carry vastly different assumptions, costs, and long-term risks. A recent industry analysis revealed that pricing for equivalent 100 kW commercial installations can vary by 15–25% across developers — making proposal evaluation a critical skill, not a formality.
A poorly evaluated proposal can lock a business into a system that underdelivers — with contracted terms that are nearly impossible to unwind once commissioned. With India adding a historic 36.6 GW of solar capacity in 2025, commercial buyers face more proposals than ever, but only a fraction reflect genuine value.
This article breaks down the financial and technical parameters that separate credible proposals from costly ones — and the evaluation mistakes that routinely drain lakhs from businesses' savings.
Key Takeaways
- A credible proposal must clearly state system size, CUF/PR assumptions, CAPEX or tariff structure, IRR, payback period, and O&M terms
- Check the developer's track record on similar-scale commercial or industrial projects — references matter
- Financial models should reflect state-specific DISCOM regulations and realistic tariff escalation rates
- Run at least 2–3 proposals through consistent benchmarks — ₹/Wp CAPEX, CUF by state, and landed tariff — before committing
- Evaluation is about identifying the best risk-adjusted return over 25 years, not just the lowest price
What a Commercial Solar Project Proposal Should Actually Contain
A solar proposal should function as both a technical blueprint and a financial roadmap — covering engineering design, cost breakdown, incentive analysis, and contractual obligations in a single document. If a proposal reads more like a brochure, that's a signal the developer hasn't done proper due diligence on your site.
Three Critical Categories of Information
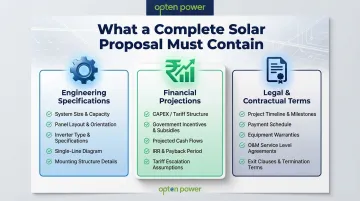
Every complete proposal should cover three areas without gaps:
Engineering specifications:
- System size in kWp or MW
- Panel layout and roof loading analysis
- Inverter type and configuration
- Single-line diagram showing electrical connections
- Mounting structure specifications for your roof type
Financial projections:
- Total CAPEX or per-unit tariff (₹/kWh)
- Applicable incentives under Indian policy
- Net cash flow projections over 25 years
- IRR and payback period calculations
- Grid tariff escalation assumptions
Legal and contractual terms:
- Project timeline with clear milestones
- Payment schedule tied to deliverables
- Warranty coverage (panels, inverters, workmanship)
- O&M scope and SLAs
- Exit clauses and performance guarantees
India-Specific Regulatory Requirements
Beyond the standard checklist, Indian proposals carry an additional layer of compliance that generic templates often miss entirely.
A complete proposal must address state-specific regulatory details: net metering eligibility, open access applicability, and DISCOM approval requirements. Verify that all equipment carries MNRE approval and BIS compliance — the ALMM List-II mandate for cells takes effect June 1, 2026, and proposals submitted after this date must confirm ALMM List-II compliance or risk rejection.
State-level rules can also directly cap your system size. Telangana limits net metering to 500 kW for C&I consumers; Gujarat restricts capacity to 50% of contract load during the first two years. A proposal that ignores these caps will fail at the grid connectivity stage.
How to Evaluate a Commercial Solar Project Proposal: Step by Step
Step 1: Verify the Developer or EPC's Credentials and Track Record
Check whether the developer has completed commercial or industrial-scale projects similar in size and sector to yours. Ask for a project portfolio showing:
- Commissioned capacity (kWp/MW)
- Client type and sector
- Years of operation for installed systems
- References you can verify directly
A rooftop installer with only residential experience is not the right partner for a 500 kW industrial installation. The engineering complexity, regulatory requirements, and performance expectations are fundamentally different.
Compliance Verification:
- MNRE guideline alignment
- BIS-compliant modules with proper certification
- Electrical contractor licenses for your state
- Financial stability to honor long-term O&M commitments
Opten Power provides access to verified developers across 16 states, so credential verification — licenses, portfolio, compliance — happens through a single pre-vetted pool rather than manual checks across each developer separately.
Step 2: Assess the System Design and Technical Specifications
Review the proposed system capacity against your actual electricity consumption data. The system size should be derived from your 12-month consumption pattern and maximum demand, not rounded up to fit a standard product package that maximizes the developer's revenue.
Equipment Quality Checklist:
- Solar panels from Tier-1 manufacturers with minimum 25-year linear performance warranty
- Inverter type (string vs. microinverter vs. optimizer) appropriate for your site
- Mounting structure specifications matched to your roof type, wind zone, and shading conditions
- Cable specifications and loss calculations
- Protection equipment (surge protection, earthing, lightning arrestors)
For example, N-Type TOPCon modules from leading manufacturers offer 30-year warranties with 0.4% annual degradation, guaranteeing 87.4% of nominal power at year 30. Older P-type modules degrade at 0.55% annually, a difference that compounds significantly over a 25-year project life.
Step 3: Scrutinize the Energy Yield Assumptions
Before accepting any production estimate, check the Capacity Utilization Factor (CUF) and Performance Ratio (PR) in the proposal. These figures must come from location-specific irradiance data — PVGIS (EU JRC) or NIWE are the standard tools for Indian sites — not benchmarks lifted from a different region.
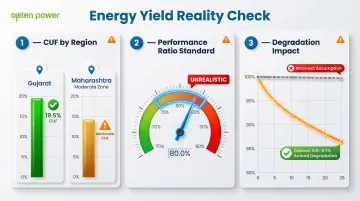
CUF Reality Check:
- High irradiance zones like Gujarat (Ahmedabad) show specific yields around 1,711 kWh/kWp (~19.5% CUF)
- Moderate zones like Maharashtra (Mumbai) yield around 2,036 kWh/m² global tilted irradiation
- Ask how the developer arrived at these numbers
- Verify they account for shading, soiling losses, and cable losses specific to your site
Performance Ratio Standards:
A PR of 80% is considered realistic for crystalline modules in Indian climatic conditions. Claims significantly above 85% are mathematically improbable and should raise an immediate red flag.
Degradation Modeling:
Check whether the energy yield projection includes year-on-year panel degradation (typically 0.5-0.7% annually for quality modules). Any proposal showing flat production numbers across 25 years is overstating lifetime savings by 10-15%.
Step 4: Scrutinize the Financial Model and Tariff Structure
For CAPEX Proposals:
The financial model should include:
- Total installed cost per Wp (currently ₹35,000-₹50,000/kWp for commercial systems)
- Applicable subsidies or accelerated depreciation benefits
- Net investment after incentives
- Annual savings based on avoided grid tariff
- 25-year cash flow showing IRR and simple payback period
Under Section 32 of the Income Tax Act, businesses can claim 40% accelerated depreciation on solar assets, with an additional 20% available for new machinery, allowing up to 60% total depreciation in year one. Ensure the financial model captures this correctly.
Tariff escalation assumptions deserve the same scrutiny. Some proposals use 6% annual escalation to inflate projected savings, but a Prayas Energy Group study of tariff orders from FY05 to FY25 shows significant revision gaps across states. A conservative 2-4% escalation band is more defensible.
For RESCO/PPA Proposals:
Scrutinize these elements:
- Per-unit solar tariff (₹/kWh) compared to your current grid tariff
- Escalation clause over the contract period
- Minimum offtake guarantees and penalties
- Exit clauses and buyout options
- Open access charges (wheeling, transmission loss, banking charges, cross-subsidy surcharge)
Open access charges can significantly erode savings. For example, Maharashtra recently hiked banking charges from 2% to 8% of energy banked, while Karnataka approved an additional surcharge of ₹0.40/kWh for FY2026.
Opten Power lets buyers compare CAPEX and PPA proposals side-by-side with instant IRR and payback calculations, with state-specific open access charges already factored in across 16 states.
Step 5: Review Project Scope, Warranties, and O&M Terms
Scope gaps are where commercial solar projects most commonly go over budget or stall at commissioning. A proposal that doesn't spell out inclusions and exclusions is a risk, not a saving.
Project Scope Clarity:
Confirm the proposal explicitly covers:
- Design, engineering, and permitting
- DISCOM interconnection approvals
- Metering and monitoring equipment
- Civil work and structural reinforcement
- Testing, commissioning, and documentation
Ask for clarity on who is responsible for roof warranty coordination, insurance during construction, and final commissioning certificates.
Warranty Verification:
- Panel performance warranty: 25-year linear output guarantee
- Inverter warranty: Minimum 5-10 years
- Workmanship warranty from EPC: Minimum 2-5 years
- O&M terms post-commissioning with response time SLAs
O&M Critical Points:
- Access to monitoring system data
- What happens if generation falls below projected levels
- Who bears inverter replacement costs after warranty period
- Annual maintenance scope and frequency
- Emergency response protocols
Key Parameters That Determine Whether a Solar Proposal Is Credible
Two proposals for the same site can show dramatically different savings figures simply because the underlying assumptions differ. Understanding these parameters lets you challenge unrealistic projections and identify the most honest developer.
Capacity Utilization Factor (CUF) and Performance Ratio (PR)
CUF determines how much electricity the system will actually produce. A developer inflating CUF by even 2-3% can make an underperforming system appear financially viable on paper — and this is one of the most common ways aggressive proposals manipulate financial outcomes.
An overstated CUF means actual energy savings will be lower than projected, extending payback and reducing IRR. To verify:
- Check typical CUF ranges for your geography against MNRE or satellite irradiance data
- Ask developers to justify their CUF assumption with a named data source
- If they can't provide this justification, their projections likely can't withstand scrutiny
Grid Tariff Escalation Rate
The escalation rate assumption — typically 3-6% per year — shapes the 25-year NPV calculation more than most buyers realize. A single percentage point difference can shift projected savings by 15-20% over the system's lifetime. Proposals using 6% escalation look far more attractive than those using 3%, even with identical systems.
Ask the developer to state the escalation rate used, then verify it against historical DISCOM tariff revision data for your state. A conservative assumption here signals a more honest financial model.
IRR, Payback Period, and Net Savings
IRR measures the efficiency of capital deployment. For commercial solar in India, a credible CAPEX investment should typically yield payback periods of 3-5 years, with IRRs varying by state tariff levels.
Be cautious of IRR figures that appear unusually high without supporting data — they're often the result of aggressive CUF, escalation, or incentive assumptions stacked together. A realistic proposal shows sensitivity analysis across conservative, base, and optimistic scenarios, not a single best-case number.
Regulatory and Grid Connectivity Costs
Open access solar projects above certain capacity thresholds attract additional charges. Under the MoP GEOA Rules 2022, these include:
- Wheeling charges
- Transmission charges
- Banking charges
- Cross-subsidy surcharge (capped at 20% of applicable tariff)
- Additional surcharge for stranded costs
Proposals that ignore or understate these costs are incomplete. Ensure the proposal explicitly accounts for all applicable state-level charges based on your DISCOM jurisdiction and consumption category. This is especially critical for industrial consumers pursuing group captive or third-party open access models.
Common Mistakes Businesses Make When Evaluating Solar Proposals
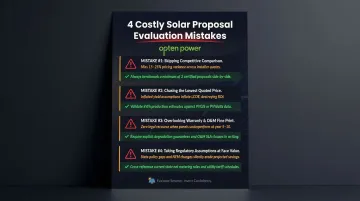
Skipping competitive comparison: Pricing for equivalent systems can vary by 15–25% across developers. Evaluating a single proposal means you have no benchmark for assumptions, scope, or tariff fairness. Request at least 2–3 proposals with standardized inputs before shortlisting.
Chasing the lowest quoted price: A low capital expenditure (CAPEX) figure or an attractive tariff often signals inflated yield assumptions, thinner equipment specs, or minimal O&M commitment. What matters is the levelized cost of energy (LCOE) over the system's lifetime — not the sticker price on page one.
Overlooking warranty and O&M fine print: Many businesses sign contracts without confirming what happens if generation falls short. Verify whether the O&M agreement includes performance guarantees, who covers inverter replacement costs after the warranty period, and whether you get direct access to live generation data — not just quarterly reports.
Taking regulatory assumptions at face value: India's solar policy varies considerably by state. Net metering caps, open access thresholds, banking norms, and renewable purchase obligation (RPO) rules differ by distribution company (DISCOM) and shift periodically. A proposal built on outdated or incorrect state-level assumptions can fall well short of its projected savings.
How to Compare Multiple Solar Proposals Side-by-Side
An apples-to-apples comparison is only possible when you standardize the inputs across proposals. Create a comparison matrix that normalizes:
- System capacity (cost per Wp)
- CUF and PR assumptions
- Grid tariff escalation rate
- IRR and payback period
- Warranty terms
- O&M scope and SLAs
Any developer unwilling to provide these data points in a structured format should be viewed with caution.
Manually reconciling multiple PDFs — each built on different assumptions — makes this harder than it needs to be. Opten Power's marketplace addresses this directly: commercial and industrial buyers can compare tariffs, savings projections, and IRR across multiple verified solar developers in real-time, with standardized financial analysis across developers operating in their state. The proposal evaluation timeline drops from days to minutes.
When comparing CAPEX and PPA/RESCO proposals for the same project, direct comparison is not straightforward. Convert both to a common metric such as Levelized Cost of Energy (LCOE) or net present value of savings over 25 years. India's unsubsidized LCOE for rooftop solar ranges from ₹3.88 to ₹5.25 per kWh — a useful industry benchmark when stress-testing developer projections.
The procurement model should align with your business's tax position, balance sheet strategy, and risk appetite — not just which proposal looks cheaper on paper.
Frequently Asked Questions
How to evaluate a solar project?
Check the developer's credentials, validate energy yield assumptions against location-specific irradiance data, verify equipment compliance, and confirm regulatory alignment. Key decision metrics are IRR, simple payback, CUF, PR, and warranty terms.
What financial metrics should I look for in a commercial solar proposal in India?
Key metrics include IRR, simple payback period, net annual savings, LCOE, and the grid tariff escalation rate used in projections. For CAPEX projects, ensure accelerated depreciation (40% in year one) and applicable tax benefits are factored into the net investment figure to accurately reflect after-tax returns.
How do I compare multiple solar proposals from different developers?
Comparison must be standardized across CUF/PR assumptions, per-Wp pricing, warranty terms, O&M scope, and regulatory cost treatment. Platforms like Opten Power enable real-time multi-developer comparison with standardized financial analysis, eliminating manual reconciliation of inconsistent proposal formats and accelerating decision-making.
What are common red flags in a commercial solar proposal?
Red flags include unusually high CUF or IRR without supporting irradiance data, no mention of open access or net metering charges, vague O&M scope with no SLAs, absence of performance guarantees, and lack of site-specific energy yield simulation. Proposals missing ALMM or BIS compliance documentation should be immediately disqualified.
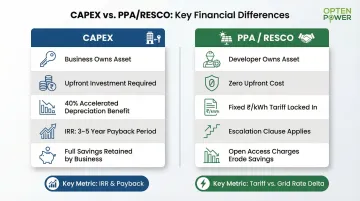
What is the difference between a CAPEX and PPA solar proposal?
With CAPEX, the business owns the system and captures all financial benefits — accelerated depreciation, savings — but requires upfront capital. With a PPA/RESCO, the developer owns the asset and sells power at a fixed tariff with no upfront cost, but the business foregoes tax benefits. The right structure depends on your tax position, capital availability, and how much performance risk you want to retain.
How many solar proposals should a business request before committing?
Request at least 3 proposals from developers with proven commercial experience in your state and sector. This lets you benchmark pricing — which can vary 15–25% — validate yield assumptions, and compare O&M scope before committing.