Introduction
India added 7.8 GW of solar open access capacity in 2025—yet many C&I buyers who signed PPAs that year are discovering their actual savings fall well short of projections. A solar farm power purchase agreement (PPA) is a long-term contract between a solar farm developer and an energy buyer—industrial, commercial, or institutional—to purchase electricity at a pre-agreed price over a fixed term, typically 10–25 years.
That gap exists because PPAs are widely discussed but operationally misunderstood. Many buyers sign multi-year commitments without fully grasping price escalation clauses, grid dependency, or regulatory risk.
This guide is for C&I businesses—manufacturers, data centres, hospitals, IT parks, hotels—evaluating whether a solar PPA is the right procurement structure. Cumulative open access installations have crossed 30 GW, but landed costs range from Rs 4.3/kWh to Rs 8.4/kWh depending on state-level open access charges that can erode 20–40% of nominal savings. The economics vary that much.
Here, you'll find a clear breakdown of how solar PPAs are structured, what drives cost differences across states, which risks matter most, and how to evaluate whether a PPA actually makes sense for your load profile.
Key Takeaways
- A solar farm PPA is a fixed-price or escalating-rate electricity supply contract between a solar developer and an off-taker, running 10–25 years
- Businesses lock in below-market electricity rates, reduce carbon exposure, and avoid upfront capital investment
- The PPA price, term, escalation rate, and delivery structure determine whether a deal actually saves money
- Key risks include DISCOM dependency, curtailment, take-or-pay obligations, and change-in-law clauses
- Best suited for high-load, daytime-heavy consumers — less viable for businesses with irregular or low energy demand
What Is a Solar Farm Power Purchase Agreement?
A solar farm PPA is a long-term, two-party energy supply contract in which a solar farm developer agrees to generate and deliver a specified volume of electricity to a buyer at a contracted tariff, without the buyer owning the solar asset.
This arrangement works for both sides:
- Buyers lock in predictable, lower-cost electricity without capital expenditure
- Developers gain revenue certainty to secure project financing
- Industries reduce dependence on grid power and volatile DISCOM tariffs
A rooftop solar lease puts the asset on the buyer's own premises; a solar farm PPA draws power from a utility-scale remote project. A green tariff routes electricity through a utility — a solar farm PPA creates a direct contractual relationship with the developer instead.
Why Businesses Choose Solar Farm PPAs
Cost Predictability Versus Tariff Volatility
Grid tariff volatility—especially for DISCOM-supplied industrial consumers—creates real budgeting uncertainty. A fixed or capped PPA rate offers long-term cost certainty. C&I buyers typically save 10–40% on energy costs through solar PPAs versus prevailing grid rates, though savings depend heavily on state-level open access charges.
Industrial grid tariffs across India range from Rs 5.40/kWh to Rs 9.01/kWh, while landed open access solar costs range from Rs 4.3/kWh to Rs 8.4/kWh. In states like Maharashtra, however, open access charges consume 51% of the landed cost—compressing the savings gap considerably.
Sustainability and ESG Imperatives
Corporate net-zero commitments and Scope 2 emission targets are pushing procurement decisions toward renewable PPAs. Global corporate clean energy PPAs reached approximately 65 GW cumulative by end-2024. Tata Steel's 966 MW solar PPA shows how heavy industry is addressing both cost and carbon at scale.
A solar PPA generates Renewable Energy Certificates (RECs) and environmental attribute documentation that supports ESG reporting. CEA's grid emission factor stands at 0.71 tCO2/MWh for FY2024-25—meaning each MW of solar at 20% CUF offsets approximately 1,244 tCO2 annually.
What Buyers Face Without a PPA Structure
Without a PPA, C&I buyers face:
- Exposure to utility tariff revisions and periodic rate increases
- Cross-subsidy surcharges that subsidize agricultural and residential consumers
- Demand charges that penalize peak consumption
- Power availability constraints during high-demand periods
Regulatory and Policy Tailwinds
Open access regulations, renewable purchase obligations (RPOs), and government incentives make solar farm PPAs commercially viable in India. The September 2025 Renewable Consumption Obligation (RCO) notification mandates renewable consumption rising from 29.91% (FY24-25) to 43.33% (FY29-30). Penalties under EC Act Section 26(3) create a hard regulatory floor for PPA demand. CERC set the RCO buyout price at Rs 347/MWh (Rs 0.347/kWh) for FY24-25 and FY25-26, with 5% annual escalation thereafter.
Scale Economics for Heavy Consumers
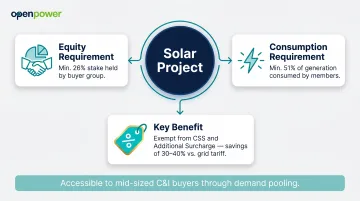
For heavy industries—steel, cement, textiles—and large commercial loads like data centres and hospitals, the scale of consumption makes the economics of a long-term PPA far more favorable than for smaller buyers. That said, scale is no longer a barrier for mid-sized buyers. The Group Captive model (26% equity, 51% consumption) lets smaller entities pool demand and access utility-scale solar—yielding approximately 20% savings versus DISCOM tariffs.
How a Solar Farm PPA Works
Conceptual Overview
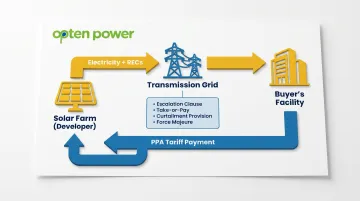
A solar developer builds and operates a utility-scale solar farm. Energy generated is wheeled to the buyer's facility through the transmission/distribution grid under an open access arrangement. The buyer pays the developer at the contracted PPA rate per unit consumed, not the grid utility rate.
What flows in both directions:
- Electricity flows from the solar farm to the buyer's consumption point
- Money flows from the buyer to the developer at the agreed tariff
- RECs or equivalent environmental attributes transfer to the buyer
How the PPA is controlled:
- Tariff escalation clauses (fixed escalation or CPI-linked)
- Minimum offtake guarantees (take-or-pay)
- Curtailment provisions
- Force majeure terms
Understanding how these clauses interact determines your actual landed cost—and your exposure if output falls short.
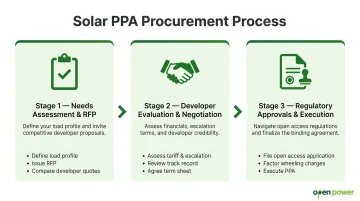
Step 1: Needs Assessment and RFP Issuance
The buyer defines its load profile: annual consumption, peak demand, daytime versus nighttime ratio. This profile determines the desired contract term, delivery point, and target tariff. The buyer then issues a Request for Proposal (RFP) to shortlist solar developers with matching available capacity.
Platforms like Opten Power let businesses issue automated RFPs and compare real-time tariff quotes from multiple pre-vetted developers across 16 states, cutting shortlisting time from weeks to days.
Key capabilities on the platform include:
- Access to 4+ GW of available renewable capacity across solar, wind, and hybrid
- Instant IRR, payback period, and regulatory impact calculations
- Pre-vetted developer profiles across 16 states
Step 2: Developer Evaluation and Commercial Negotiation
The buyer evaluates developer proposals based on:
- PPA tariff rate
- Escalation clause structure (annual increases of 1–2% are common)
- Project commissioning timeline
- Financial standing and EPC track record
- Grid connectivity status
A term sheet is exchanged, and commercial negotiation covers floor/ceiling tariff limits, minimum offtake percentages, force majeure definitions, change-in-law provisions, and termination/exit clauses. SECI's standard PPA requires a Letter of Credit covering one month's billing as payment security—a mechanism C&I PPAs typically replicate.
Step 3: Regulatory Approvals and Contract Execution
Once commercial terms are agreed, the open access application is filed with the relevant state DISCOM or transmission utility. Wheeling, banking, and transmission charges are factored into the effective landed cost. The PPA is executed once approvals are in place. The solar farm enters construction or commissioning phase before energy supply begins.
The Green Energy Open Access (GEOA) Rules 2022 lowered the eligibility threshold from 1 MW to 100 kW, enabling smaller C&I consumers. The GOAR portal processes applications within 15 days. The rules permit banking at least monthly, capped at 30% of total monthly consumption, with 8% banking charges deducted in kind.
Key Factors That Determine PPA Terms and Value
PPA Tariff and Escalation Structure
The rate structure determines long-term cost: fixed flat, annually escalating (typically 3–5% per year), or hybrid. Benchmark utility-scale solar tariffs have reached Rs 2.44–2.55/kWh in competitive bidding, while CERC approved tariffs of Rs 3.35–3.36/kWh for NTPC's 1,200 MW wind-solar hybrid projects. The escalation rate over a 20-year term can fundamentally change total cost versus grid tariffs. A 3% annual escalation doubles the tariff over 24 years.
Wheeling, Banking, and Open Access Charges
The "last mile" costs sit between the PPA rate and the actual landed cost at the buyer's meter. These include:
- Wheeling charges (Rs 0.33–1.10/kWh depending on state)
- Cross-subsidy surcharge (CSS) (Rs 1.33–1.92/kWh)
- Additional surcharge (Rs 0.10–2.46/kWh)
- Scheduling losses (typically 2–4%)
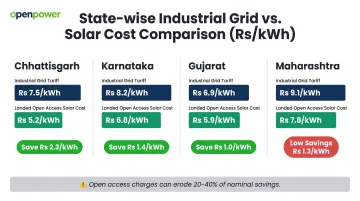
These vary significantly by state and can erode 20–40% of nominal savings if not modeled accurately. In Maharashtra, open access charges comprised 51% of the landed cost in Q3 2024. In Gujarat, third-party open access solar projects offered no net savings because grid tariffs are already low (Rs 3.55–4.30/kWh).
State comparison:
| State | Industrial Tariff | Landed OA Cost | Est. Savings |
|---|---|---|---|
| Chhattisgarh | Rs 6.85-7.55 | ~Rs 4.3 | Highest |
| Karnataka | Rs 6.90 | Moderate | ~30% (captive) |
| Gujarat | Rs 3.55-4.30 | Low-Moderate | Negative (3rd party) |
| Maharashtra | ~Rs 9.01 | ~Rs 8.4 | Low-Moderate |
Offtake Commitment and Load Matching
The buyer's actual consumption pattern versus the solar farm's generation profile determines how much energy is used at the PPA rate versus supplemented from the grid. Solar generation peaks during daytime hours (9 AM–4 PM), so high daytime loads—manufacturing, IT parks—benefit more than shift-heavy operations.
Take-or-pay obligations require buyers to pay for minimum contracted quantities even during factory shutdowns or low-consumption periods. A misaligned load profile means paying for unconsumed solar units while still purchasing balance power from the grid at full tariff.
Contract Term and Exit Provisions
Longer terms (20–25 years) typically secure lower base tariffs but increase exposure to regulatory and technology change. SECI's standard PPA specifies a 25-year term from Commercial Operation Date, while C&I-specific structures commonly adopt 10–15 year terms reflecting shorter business planning horizons.
Exit clauses, termination penalties, and change-in-law provisions determine flexibility. First-time buyers often under-negotiate these provisions. Change-in-law clauses should specify whether increases in open access charges, CSS, or additional surcharges can be passed through to the buyer mid-contract.
Developer Creditworthiness and Project Commissioning Risk
The buyer is exposed if the developer delays commissioning or defaults. Due diligence must cover:
- Developer's financial strength and balance sheet
- EPC track record and execution capability
- Grid connectivity status and GNA (General Network Access) confirmation
- Land security and environmental clearances
In Rajasthan, 22,500 MW is commissioned and approved while total GNA capacity stands at only ~14,000 MW, resulting in curtailment of up to 48% during peak hours. Buyers procuring from Rajasthan-based projects face real generation shortfall risk despite contracted capacity.
Common Misconceptions About Solar Farm PPAs
Misconception: The PPA Rate Is the Landed Cost
Many buyers compare only the headline PPA tariff against their grid bill—without accounting for wheeling charges, banking costs, scheduling losses, and minimum offtake penalties. The actual landed cost is almost always higher.
In Maharashtra, for example, a headline tariff of ₹4.5/kWh can land closer to ₹8.4/kWh once you add:
- Cross-subsidy surcharge (CSS): ₹1.79/kWh
- Wheeling charges: ₹0.60/kWh
- Additional surcharge and scheduling losses
Ignoring these components leads to overstated savings projections — sometimes by 40–50%.
Misconception: PPAs Are Only for Large Conglomerates
Headline deals grab attention — Meta, Amazon, and Google signing hundreds of megawatts — but C&I PPAs covering 1–10 MW loads are standard practice in India.
The Group Captive structure makes this accessible for smaller buyers. Entities pool demand, hold a minimum 26% equity stake, and commit to consuming at least 51% of generation. That structure exempts them from CSS and additional surcharge, cutting landed costs by 30–40% compared to grid tariffs.
Misconception: Signing a PPA Means Owning the Solar Project
Some buyers assume signing a PPA means they are investing in or owning a share of the solar project. Under a standard PPA, the developer retains full ownership and operational responsibility. The buyer only purchases output — no capex, no O&M liability, no balance sheet impact.
This is a key distinction from the Captive model (where the buyer owns 100% of the asset) and the Group Captive model (which requires a 26% equity stake). For buyers who want solar economics without asset ownership, a PPA is the cleaner path.
When a Solar Farm PPA May Not Be the Right Fit
Low or Intermittent Load Profiles
Businesses with seasonal manufacturing, warehouses with irregular operations, or facilities operating primarily at night may not sustain minimum offtake commitments. A cost-saving contract converts into a take-or-pay liability during low-consumption periods. Solar generation is unavailable during nighttime hours, requiring grid supplementation or storage—adding cost.
States with High Open Access Charges
States with restrictive banking policies or high open access charges significantly compress real savings. Tamil Nadu illustrates this clearly. Stacking the applicable charges produces a landed cost that leaves almost no margin against the grid tariff:
| Charge Component | Rate (Rs/kWh) |
|---|---|
| Cross-Subsidy Surcharge (CSS) | 1.92 |
| Wheeling charges | 1.04 |
| Additional surcharge | 0.10–0.54 |
| Effective landed cost | ~7.06–7.50 |
| Grid tariff (reference) | 7.25 |
With a landed cost approaching or exceeding grid rates, the arbitrage case collapses.
Decision Driven by ESG Optics Rather Than Economics
If the decision is driven primarily by ESG optics without rigorous tariff comparison, or if consumption is predominantly night-shifted where solar output is unavailable, alternative structures may better serve operational and financial goals:
- Subscribe to green tariff programs through DISCOMs for simpler compliance
- Procure RECs only, avoiding physical power delivery obligations entirely
- Deploy on-site rooftop solar with storage to match daytime generation to actual load
Frequently Asked Questions
How much revenue can a solar farm generate per acre?
Revenue per acre depends on installed capacity (typically 5–6 MW per 20 acres for utility-scale solar), the contracted PPA rate, and annual generation hours. At 20% CUF and Rs 4/kWh PPA rate, a 5 MW farm on 20 acres generates approximately Rs 3.5 crore annually, or Rs 17.5 lakh per acre per year. Location-specific irradiation and state policies are the primary variables.
Are solar power purchase agreements worth it for solar farms?
PPAs are generally worthwhile for solar farm developers because they provide guaranteed revenue that unlocks project financing. For buyers, they lock in below-market electricity rates, though the actual value depends on tariff negotiation quality, escalation structure, and cost modeling that accounts for wheeling charges, CSS, and additional surcharge.
Can a solar farm sell power back to the grid?
Solar farms can sell surplus or uncommitted power to the grid through merchant sales or bilateral agreements. However, most utility-scale solar farms operate under long-term PPAs that commit full output to a contracted buyer. Grid sales are typically used only for excess or banked units not consumed by the off-taker.
What is the typical contract duration for a solar farm PPA?
Most solar farm PPAs run for 15–25 years, with shorter 10–12 year structures becoming more common for C&I buyers. Longer terms usually secure lower base tariffs but increase change-in-law and technology risk exposure. SECI's standard PPA uses a 25-year term; C&I contracts typically adopt 10–15 years.
What are the main risks for a buyer in a solar farm PPA?
Core buyer risks include take-or-pay obligations, developer default or commissioning delays, change-in-law provisions that alter open access charges mid-contract, and escalation clauses that may outpace grid tariff growth. Grid curtailment is an operational risk too: Rajasthan has seen 4 GW of contracted capacity face curtailment, disrupting energy delivery despite active agreements.
How is PPA pricing different from grid electricity tariffs?
PPA pricing is a bilaterally negotiated fixed or escalating rate locked at contract signing, whereas grid tariffs are regulated by state electricity commissions and revised periodically. The PPA rate is typically set below projected future grid tariffs, but actual savings depend on how those tariffs evolve over the contract term and whether open access charges rise.